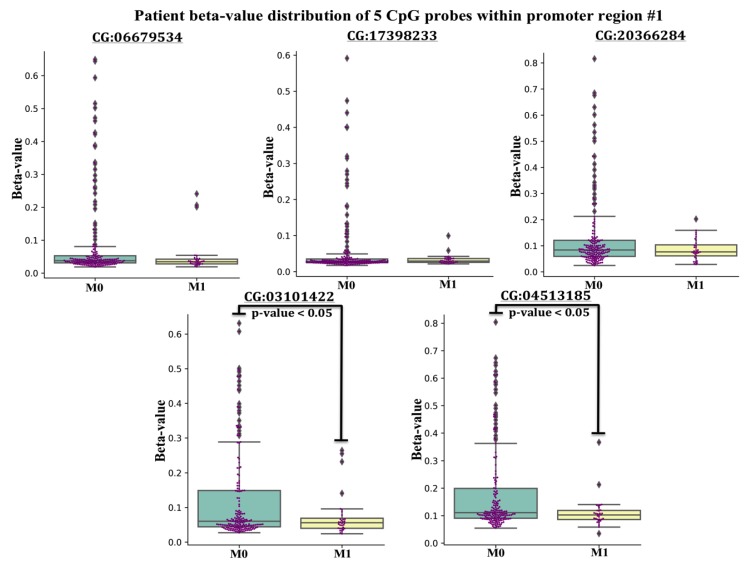
Figure 3.
5 Boxplots displaying methylation beta-values (Y-axis) of 5 probes within promoter CpG island region #1, extracted from CRC patients classified in the Tumor, Node, Metastasis (TNM) staging system as M1 = evidence of metastasis and M0 = no evidence of metastasis from the TCGA registry. The [CG########] ID on the X-axis of each boxplot represents the unique ID of each probe within the 450K-array data set. A student t-test was conducted in finding mean beta-value differences for two CG probes between M0 and M1 cohorts (p-value < 0.05).

