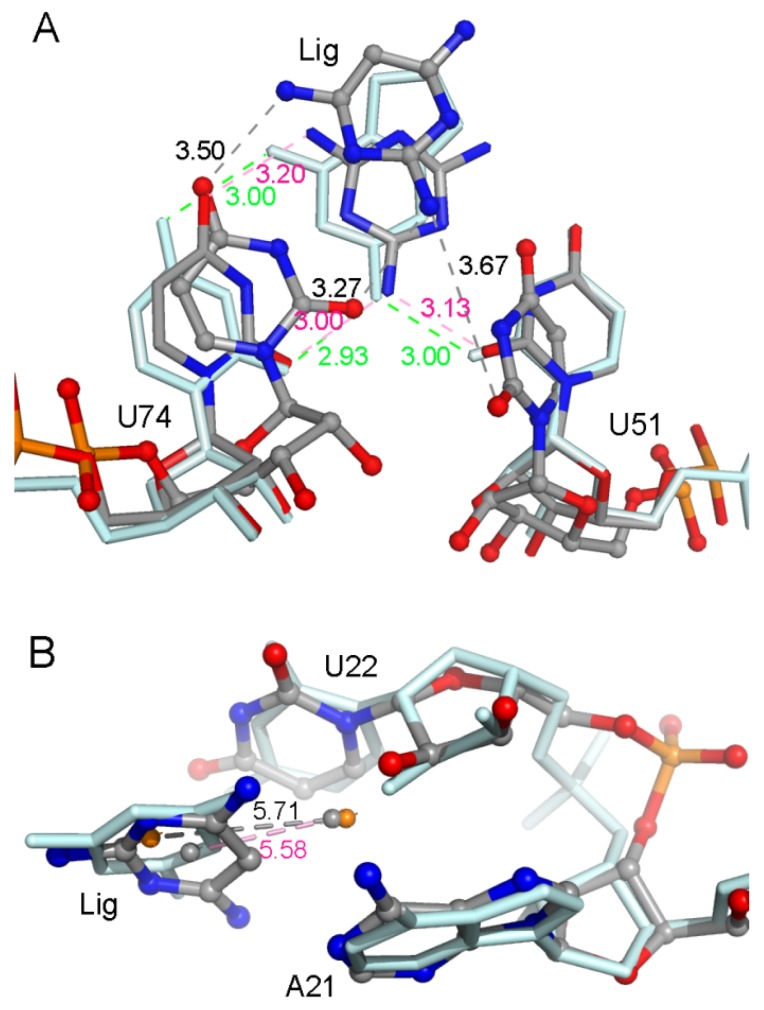
Figure 4.
(A) Comparison of the H-bonds formed between ligands (6AP, 3AY, and 3TT) and nucleotides U51 and U74 in the GR(C74U) complexes; the representative structures are from the MD simulation. The distances of H-bonds are labeled in black, red, and green colors in 3AY, 3TT, and ADE, respectively. (B) The distances between the mass centers of 3AY/3TT and the two aromatic rings of A21 and U22 are labeled. The representative structures of ligands and nucleotides are from MD simulations; they are shown in stick-and-ball representation for the 3AY complex and in stick representation for the 3TT complex.

