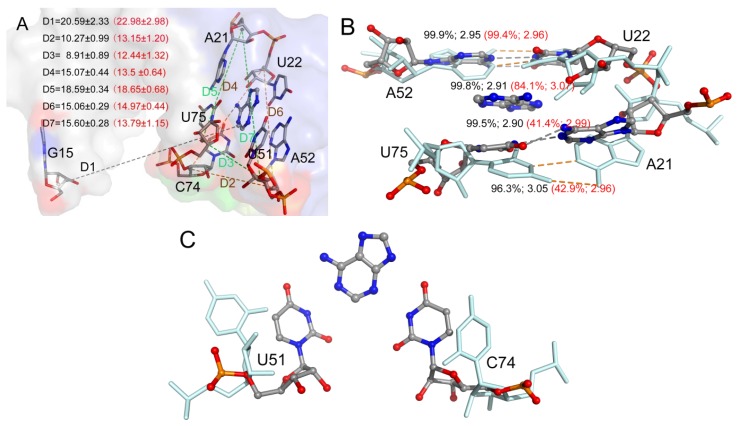
Figure 6.
(A) Seven average distances labeling the binding pocket and conformational change between the mass centers of the backbone atoms of two nucleotides. The distance values with standard deviation are shown for the complex and monomer in black and red colors, respectively. (B) The H-bonds formed between key nucleotides in the binding pocket labeled with occupancies and average distances. (C) The position of two key nucleotides U51 and C74 in the complex and monomer.

