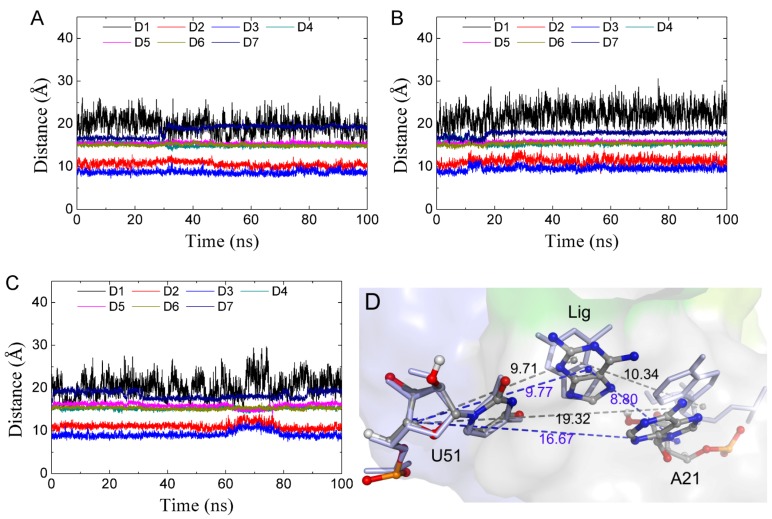
Figure 7.
The key distances described in Figure 6 versus MD simulation time. (A) Closed state. (B) Conformational change at the start of the MD simulation. (C) Open state in the middle of the MD simulation. (D) The position of A21 for two representative structures of D7.

