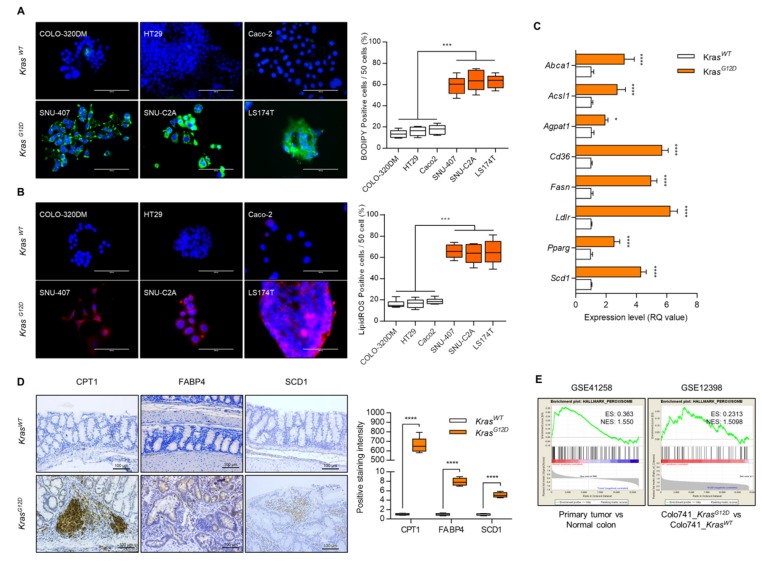
Figure 1.
Dysfunction of lipid metabolism in KrasG12D colorectal cancer (CRC) cells. (A) BODIPY staining and (B) lipid reactive oxygen species (ROS) staining using KrasG12D and KrasWT cell lines. Positive cells were counted for every 50 cells in 3 different fields at 400× magnification. Results shown are representative of at least 3 independent experiments. Scale bars: 100 μm. (C) Expression level of genes involved in lipid metabolism in KrasG12D CRC cells and presented as the fold change of KrasWT CRC cells. Rn18s was used as an endogenous control. Results are representative of at least 3 independent experiments. (D) Immunohistochemical staining with CPT1, FABP4, and SCD1, and positive cells were counted (n = 4). Scale bars: 100 μm. (E) GSEA analysis using GEO datasets (CRC patient biopsy dataset, GSE41258 and KrasG12D transfected CRC cell line dataset, GSE12398). Values are presented as means + SD. A two-tailed Student’s t-test was used for statistical analysis. * p ≤ 0.05, *** p < 0.001, **** p < 0.0001.

