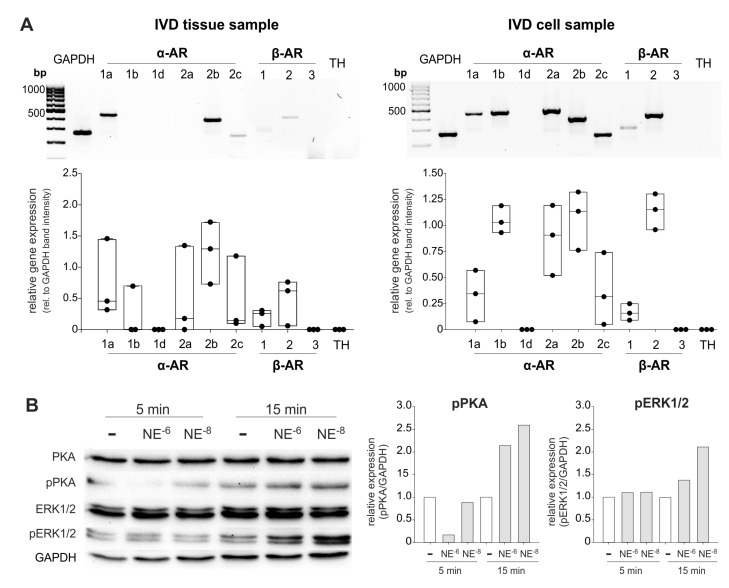
Figure 6.
AR gene expression and NE-mediated activation of intracellular signaling pathways in human IVD cells. (A) Gene expression of different AR subtypes in untreated primary IVD cells isolated from three patients (representative RT-PCR image of one IVD donor) compared to the respective tissue sample. (B) Changes in PKA and ERK1/2 phosphorylation in isolated IVD cells after treatment with low or high NE concentrations (10−8 or 10−6 M) after 5 or 15 min ((n = 3); representative Western Blot images of cells isolated from one IVD donor). The expression of phosphorylated kinases (pPKA and pERK1/2) is shown relative to GAPDH expression (set as 1). White boxes indicate untreated controls, the grey boxes the NE-treatment groups.

