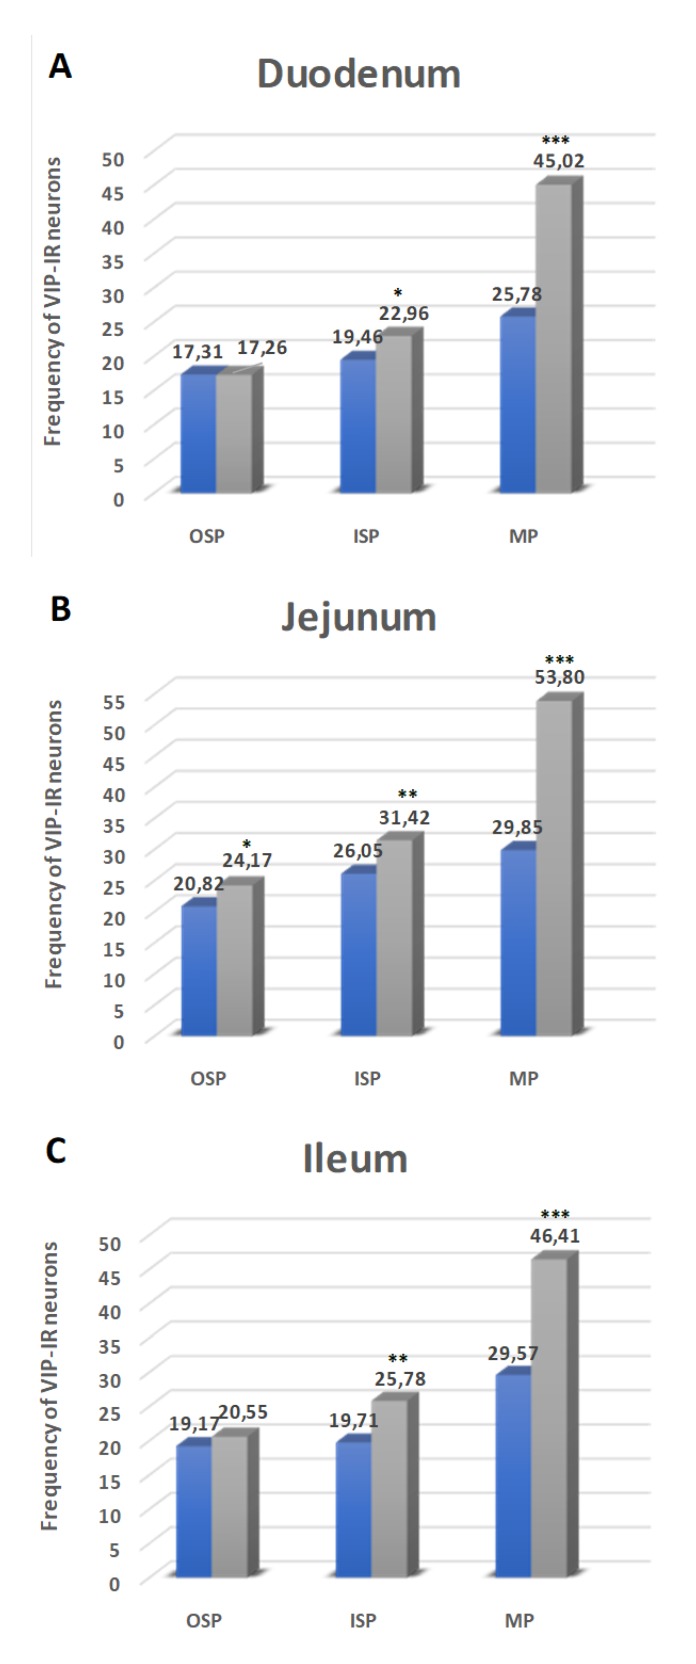
Figure 5.
Schematic diagram of the numbers of perikarya immunoreactive to a vasoactive intestinal polypeptide (VIP) (A–C) of the control (blue bars) and experimental group (grey bars) in the particular parts of the small intestine. OSP – outer submucosal plexus, ISP—inner submucosal plexus, MP—myenteric plexus. * p < 0.05, ** p < 0.01, *** p < 0.001—indicate differences between all groups for the same neuronal populations.

