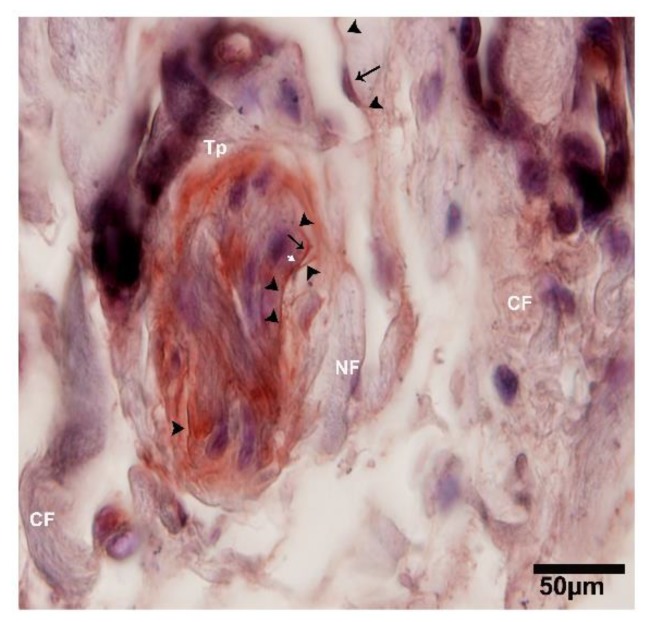
Figure 10.
CD34-positive and α-SMA-positive for TCs and endothelial cells, where TCs surround the large duct within the connective tissue. At lower magnification image of IHC stained CD34-positive. Around the duct, Tps show a cluster deposition and form a triangular shape, along with the nerve fibers. The nuclei of the telocytes are stained blue and the podoms are indicated with the black arrows, while the prolongations of cells are shown with arrowheads and the junctions between two Tps are indicated with the white arrow. NF, nerve fibers; CF, collagen fibers; Tp, telopodes. Scale bar = 50 µm.

