Figure 4.
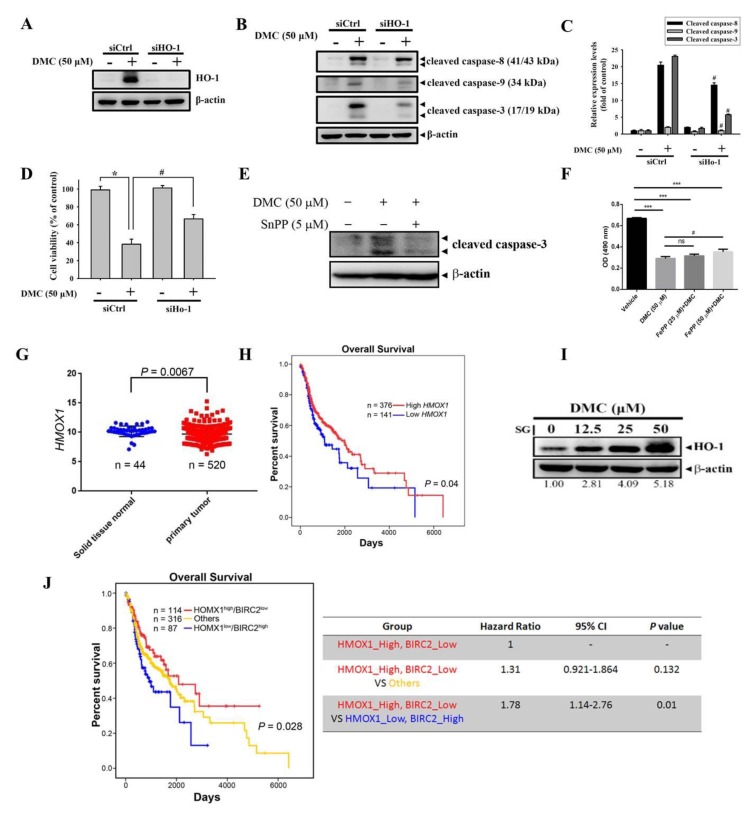
Heme oxygenase (HO)-1 is an upstream regulator involved in demethoxycurcumin (DMC)-induced caspase activation and the subsequent induction of apoptosis in oral squamous cell carcinoma (OSCC) cells. (A–D) HSC-3 cells were transiently transfected with HO-1-specific siRNA or control siRNA (siCtrl) and subjected to Western blot and MTT assays. The knockdown efficiency of HO-1 siRNA is shown in A. HO-1-specific siRNA reversed the DMC-induced increases in cleaved caspases-3, -8, and -9 (B,C) and the decrease of cell proliferation (D) of HSC-3 cells. Data are presented as the mean ± SD of three independent experiments. * p < 0.05, compared to the vehicle group; # p < 0.05, compared to the siCtrl-transfected group. (E) Enzyme activity of HO-1 is essential for the pro-apoptotic effect of DMC in OSCC cells. SCC-9 cells were treated with DMC in the presence or absence of the HO-1 enzymatic inhibitor, SnPP (5 μM), for 24 h, and the expression of cleaved caspase-3 was analyzed by a Western blotting analysis. (F) The effect of combined treatment with DMC and iron protoporphyrin IX (FePP)/heme on cell viability of OSCC cells. SCC-9 cells were treated with DMC (50 μM) simultaneously with or without FePP (25 or 50 μM) for 24 h and then subjected to MTS assay to determine the cell viability. Columns, mean (n = 3); bars, SD. *** p < 0.001 compared with the vehicle group. # p < 0.05 compared with the DMC-treated only group. ns: not significant. (G) Expressions of mRNA levels of HMOX1 (FPKM) in normal tissues (n = 44) and primary head–neck tumors (n = 520). (H) Correlation of HMOX1 expression and overall survival (OS) in head–neck squamous cell carcinoma using a Kaplan–Meier analysis. (I) SG cells were treated with indicated concentrations of DMC for 24 h, and a Western blot analysis was used to detect expression levels of HO-1. (J) All patients were separated into a negative correlation of HMOX1 and BIRC2 expression, low HMOX1 and high BIRC2 (H0B1), and high HMOX1 and low BIRC2 (H1B0), and others. Data showed that patients in the H1B0 group had the most favorable prognosis (overall p-value of 0.028). In the negative-correlated groups, patients in the H0B1 group had a worse prognosis than those in the H1B0 group (p = 0.01). The head–neck cancer dataset was retrieved from The Cancer Genome Atlas (TCGA).

