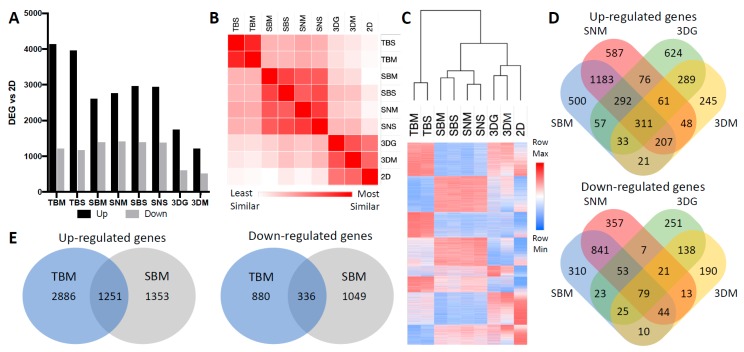
Figure 2.
Transcriptomic variability of cancer cells under different culturing conditions. (A) Quantity of differentially expressed genes (DEGs) compared to 2D samples. DEGs were defined as greater than 2-fold change and FDR < 0.05 (n ≥ 4). Cultured condition abbreviations: TBM: whole Tumor from BALB/c Mammary fat pad; TBS: whole Tumor from BALB/c Subcutaneous back flank; SBM: Sorted BALB/c Mammary fat pad; SBS: Sorted BALB/c Subcutaneous; SNM: Sorted NSG Mammary fat pad; SNS: Sorted NSG Subcutaneous; 3DG: 3D spheroids in hydroGel; 3DM: 3D spheroids in Media; 2D: 2D monolayer. (B) Similarity matrix based on whole transcriptome similarity of average expression values within each condition. Similarity differences calculated using Euclidean distance. (C) Heat map and dendrogram of whole transcriptome based on normalized logarithmic average expression values within each condition and hierarchal clustering of samples based on Euclidean distance. (D) Venn diagrams representing overlapping up- and down-regulated DEGs from 4T1 cultured from immunocompetent tumors, immunodeficient tumors, spheroids in gel, and spheroids in media compared to monolayer culture. (E) Venn diagrams representing overlapping up- and down-regulated DEGs from BALB/c MFP whole tumor vs. BALB/c MFP-sorted 4T1 compared to monolayer culture.

