Figure 3.
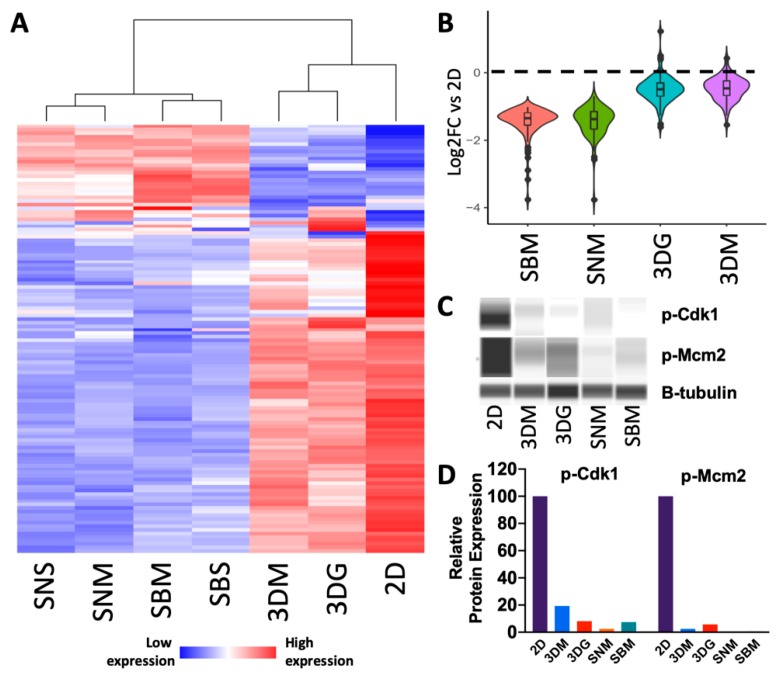
Cell cycle progression genes are up-regulated in cells cultured in monolayer culture. (A) Heat map of differentially expressed cell cycle genes (Supplementary Table S4) relative to 2D culture depicting increased down-regulation as culturing complexity increases (n = 4–5). (B) Violin plot depicting magnitude of down-regulation and distribution of SBM vs. 2D up-regulated cell cycle progression genes across other culturing conditions relative to 2D culture. (C) Pseudogel representation of protein levels of phosphorylated cell cycle genes (Cdk1 and Mcm2) from 4T1 cells cultured across multiple conditions. (D) Quantification of protein levels relative to β-tubulin.

