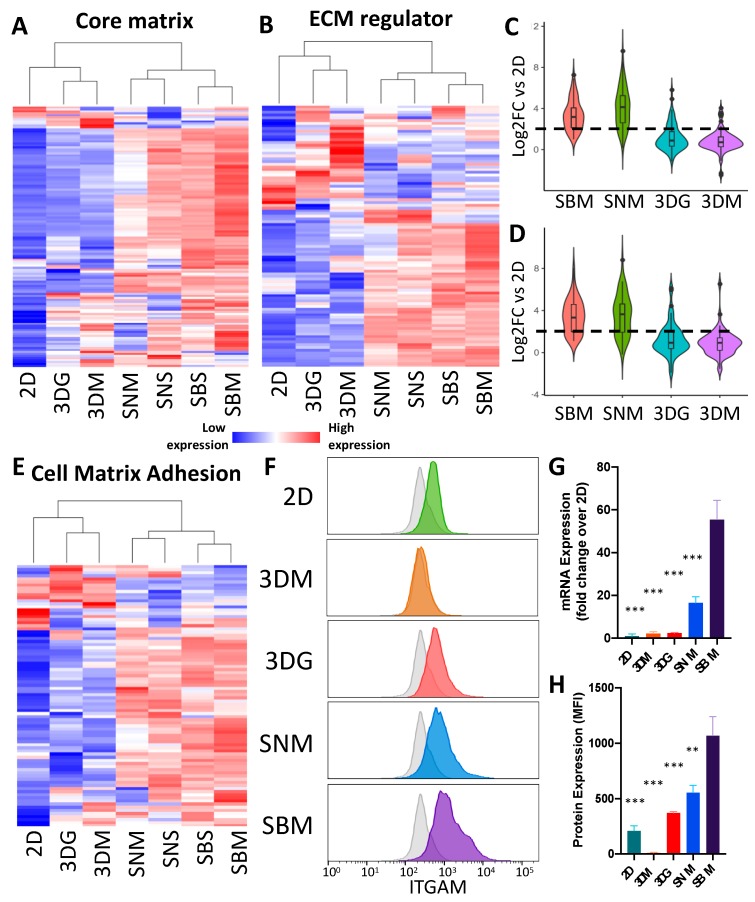
Figure 4.
Extracellular matrix organization genes are up-regulated in cells cultured in 3D and in vivo conditions. Heat maps of differentially core matrix genes (A) (Supplementary Table S5) and ECM regulator genes (B) (Supplementary Table S6) relative to 2D culture. Expression values represented are an average of 4–5 replicates. Violin plots depicting magnitude of up-regulation and distribution of SBM vs. 2D up-regulated core matrix genes (C) and ECM regulator genes (D) across other culturing conditions relative to 2D culture. Violin plot depicting magnitude of up-regulation and distribution of SBM vs. 2D up-regulated core matrix genes across other culturing conditions relative to 2D culture. (E) Heat map of differentially expressed cell matrix adhesion genes (Supplementary Table S7) relative to 2D culture (n = 4–5). (F) Histogram of representative Itgam abundance of single cancer cells cultured in different methods. Grey shaded plots represent unstained controls. (G) mRNA expression levels of Itgam in 4T1 cells under differing culturing condition. Expression levels normalized to 2D culture ± SEM. (n = 4–5). (H) Bar graph of flow cytometric analysis of ITGAM protein expression showing up-regulation in 3DG and in vivo conditions. Protein expression values represent background (unstained control) subtracted median fluorescent intensity of cancer cells ± SEM; (n = 4). (** p value < 0.001; *** p value < 0.0001 relative to SBM).

