Figure 5.
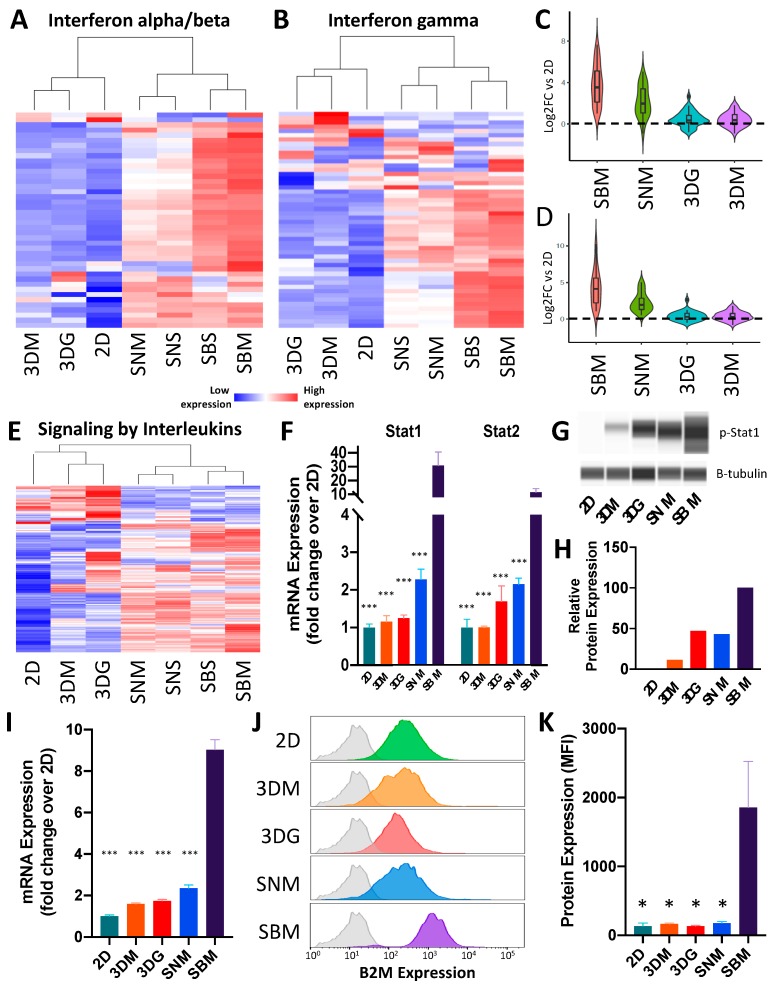
Cell signaling is highly up-regulated under syngeneic culturing conditions. (A) Heat map of differentially expressed interferon alpha/beta signaling genes (Supplementary Table S8) relative to 2D culture (n = 4–5). (B) Heat map of differentially expressed interferon gamma signaling genes (Supplementary Table S9) relative to 2D culture (n = 4–5). (C) Violin plot depicting magnitude of up-regulation and distribution of SBM vs. 2D up-regulated interferon alpha/beta signaling genes across other culturing conditions relative to 2D culture. (D) Violin plot depicting magnitude of up-regulation and distribution of SBM vs. 2D up-regulated interferon gamma signaling genes across other culturing conditions relative to 2D culture. (E) Heat map of differential signaling by interleukin genes (Supplementary Table S10) relative to 2D culture (n = 4–5). (F) mRNA expression levels of Stat1 and Stat2 in 4T1 cells under different culturing conditions. Expression levels normalized to 2D culture ± SEM (n = 4–5). (G) Pseudogel representation of protein levels of phosphorylated Stat1 from 4T1 cells cultured across multiple conditions. (H) Quantification of p-Stat1 protein levels relative to β-tubulin. (I) mRNA expression levels of B2M in 4T1 cells under differing culturing conditions. Expression levels normalized to 2D culture ± SEM; n = 4–5. (J) Histogram of representative Beta-2-microglobulin (B2M) abundance of single cancer cells cultured in different methods. Grey shaded plots represent unstained controls. (K) Bar graph of flow cytometric analysis of B2M protein expression showing up-regulation in BALB/c MFP. Protein expression values represent background (unstained control) subtracted median fluorescent intensity of cancer cells ± SEM (n = 4). (* p value < 0.05; *** p value < 0.0001 relative to SBM).

