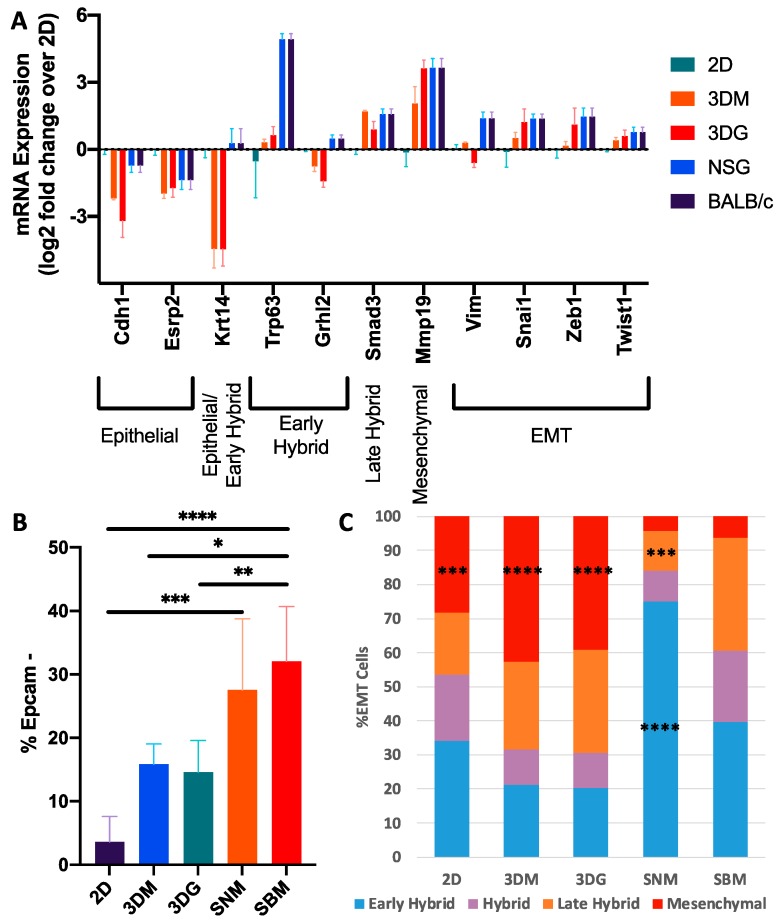
Figure 6.
The 4T1 cells in vivo reside in multiple transitional epithelial-to-mesenchymal transition (EMT) states. (A) The 4T1 log2 expression of EMT-related genes under different culturing methods relative to 2D culture. Error bars ± SEM. (B) Proportion of cells lacking Epcam expression based on flow cytometric analysis (n = 4–7). Error bars ± SD. (C) Distribution of EMT cells across hybrid EMT states induced by the culturing method (n = 4–7). * p < 0.05, ** p < 0.0005, *** p < 0.0005, and **** p < 0.0001 relative to SBM.

