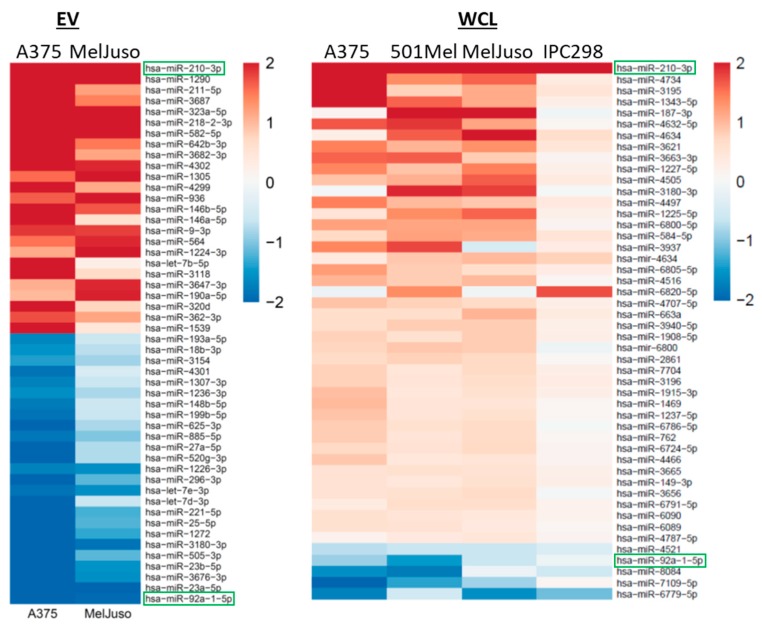
Figure 6.
miRNA profiling of melanoma EVs and WCLs. Heatmap showing the top 25 miRNAs differentially up- (red) or downregulated (blue) in A375 and MelJuso hEVs compared to nEVs (left) and regulated miRNAs in hWCLs compared to nWCLs in all four cell lines (right). Colours indicate the fold change in expression relative to normoxia (log2 scale). miRNAs found in both EVs and WCLs are framed in green.

