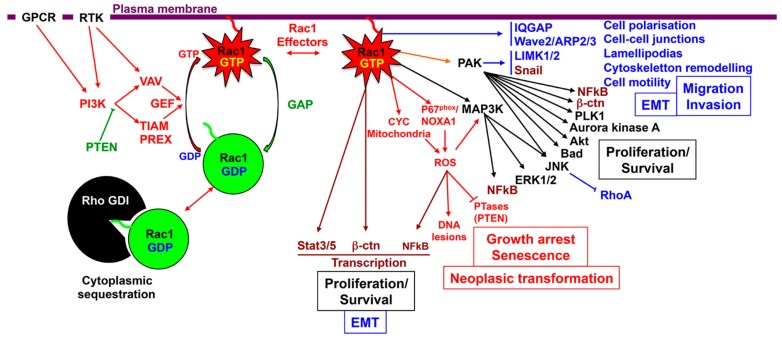
Figure 2.
Schematic representation of Rac1 signaling pathways and their biological significance. Rac1 upstream regulators: the Rac1 activating and inhibitory pathways are represented in red and in green respectively. Rac1 interacting partners and downstream effectors: transcription factors are represented in brown, effector molecules in black, pathways involved in cytoskeleton remodeling and cell migration in blue, and ROS pathway in Red.

