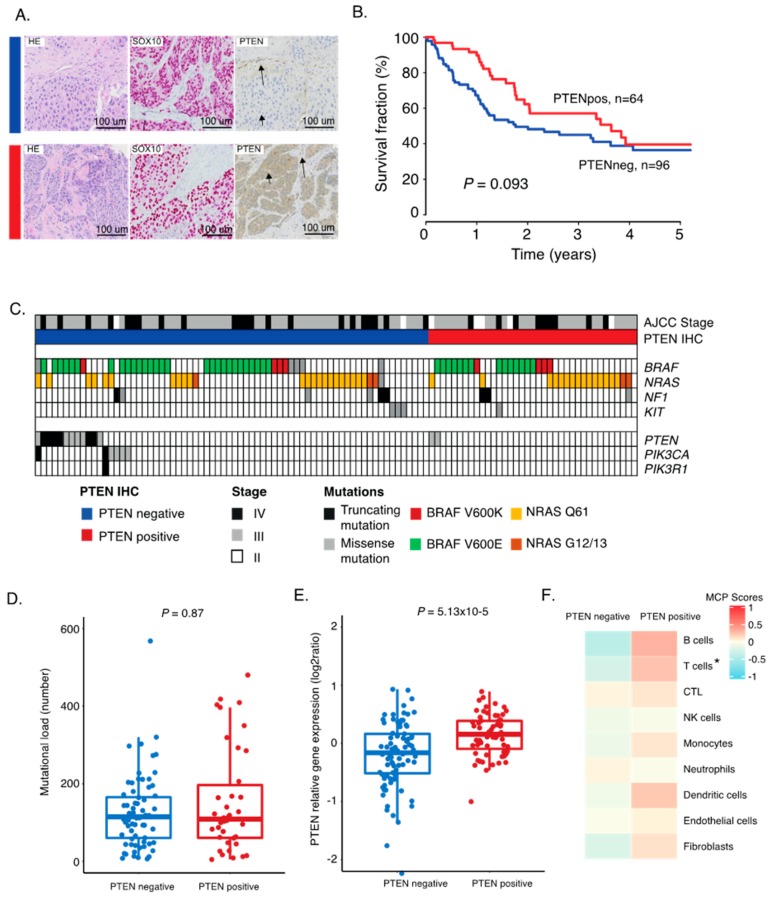
Figure 1.
Characterization of PTEN expression groups in melanoma tumors. (A) Immunostaining of HE, SOX10, and PTEN on tissue microarray representative cores. Sections were taken consecutively. A PTEN-negative case and a PTEN-positive case are shown. Arrowheads indicate tumor cells, and arrows indicate non-tumor cells. (B) Kaplan–Meier survival analysis using log-rank tests of PTEN. (C) Mutational pattern of representative genes of the MAPK and PI3K pathways in PTEN-positive and -negative tumors. Twelve tumors in the PTEN negative group had PTEN mutation; six cases had PIK3CA mutation; and one harbored PIK3R1 mutation. Among the PTEN-positive tumors, only two PTEN mutated tumors were found. (D) Mutational load across PTEN grouping. (E) Boxplot of gene expression of the PTEN gene between PTEN-positive and -negative tumors. p-values in boxplots were calculated using Wilcoxon analysis. (F) Average microenvironment cell populations (MCP) in PTEN-positive and PTEN-negative groups displayed in a heatmap. * FDR < 0.05. All others were non-significant.

