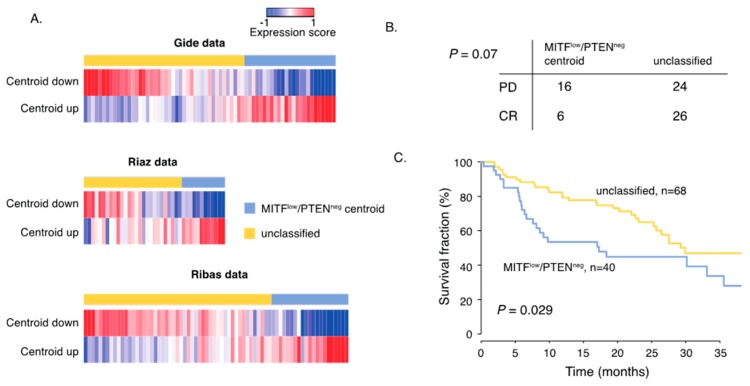
Figure 5.
MITFlow/PTENneg gene signature predicts response to MAPK inhibitors and immune checkpoint blockade (ICB). (A) Heatmaps display the expression score of the MITFlow/PTENneg centroid (up- and down-regulated genes in the centroid separately) in the ICB and BRAF/MEK inhibitor datasets. (B) Response data show the number of patients that developed PD (partial disease) or CR (complete response) to BRAFi/MEKi treatment in the two transcriptional groups. p-values were calculated using Fishers exact test. (C) Kaplan–Meier survival analysis using log rank tests of MITFlow/PTENneg tumors and the unclassified group in ICB treated patients.

