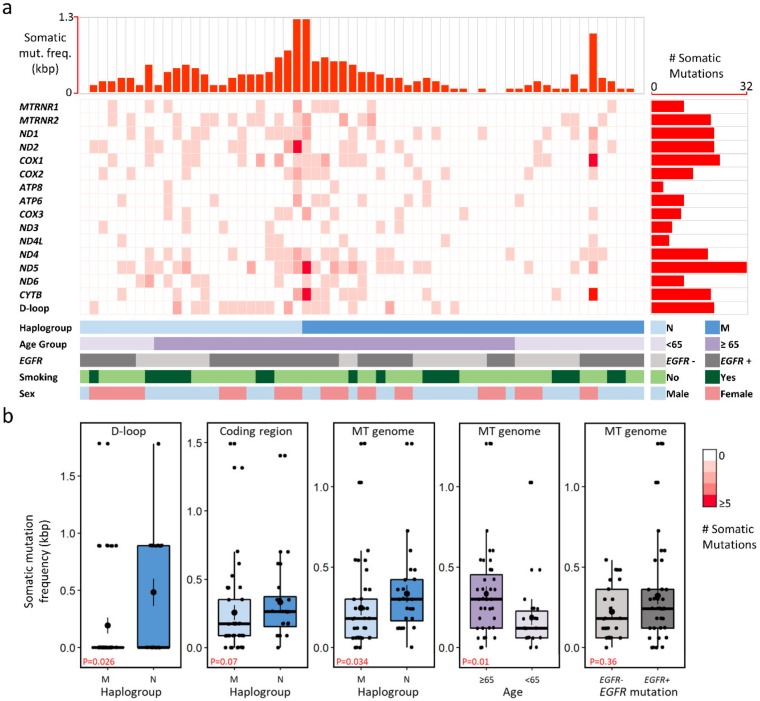
Figure 2.
Somatic mutations identified in stage I LUAD patients. (a) Profile of mitochondrial somatic mutations; each column and row represent a sample and mitochondrial gene, respectively. The color intensity corresponds to the mutation count in a particular sample. (b) Somatic mutation frequency (per kbp) in mitochondrial genomic regions with respect to haplogroup, age, and EGFR-activating mutation status. Abbreviations- EGFR+: patients harboring EGFR-activating mutations, EGFR−: patients without EGFR-activating mutations.

