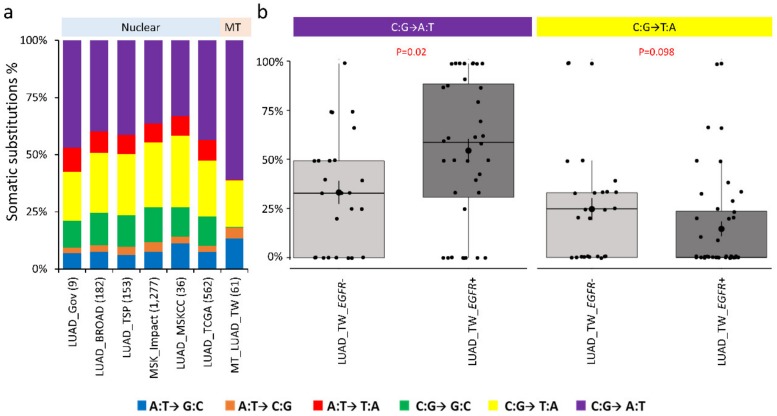
Figure 4.
Comparison of nucleotide substitutions. (a) Comparison of somatic nucleotide substitution profiles of nuclear genomes from various studies and mitochondrial genomes. (b) Distribution of C to T transitions (G to A) and C to A (G to T) transversions among patients with and without EGFR-activation mutations.

