Figure 4.
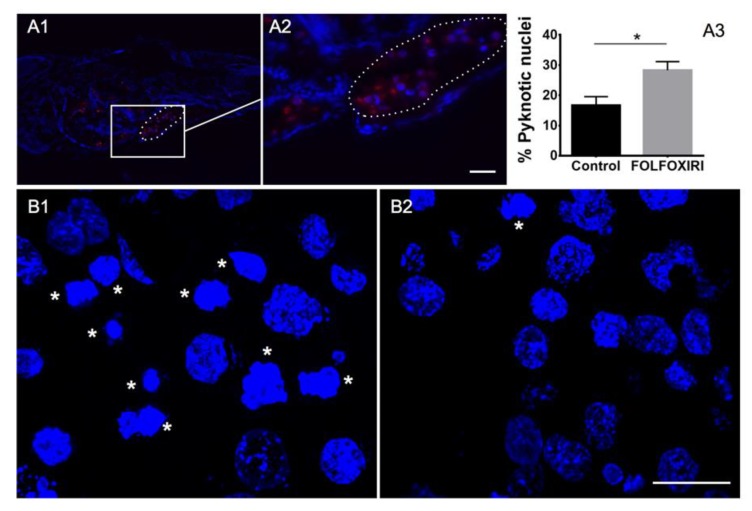
Cancer cell engraftment into zebrafish embryos 2 days after injection. (A1,A2) HCT 116 cancer cell line DiI labeled (red) injected into the yolk sac (circled) of zebrafish embryo 2 dpf. (A3) Quantification of pyknotic nuclei by HCT 116 cancer cells xenotransplanted after two days of FOLFOXIRI treatment vs. control. Data are mean ± SEM, t-test, n > 15 * p < 0.05. Sections from HCT 116 cancer cells xenotransplanted in a zebrafish embryo treated with FOLFOXIRI (B1) vs. control (B2). Stars: cells with pyknotic nuclei. Scale bar: 50 µm.

