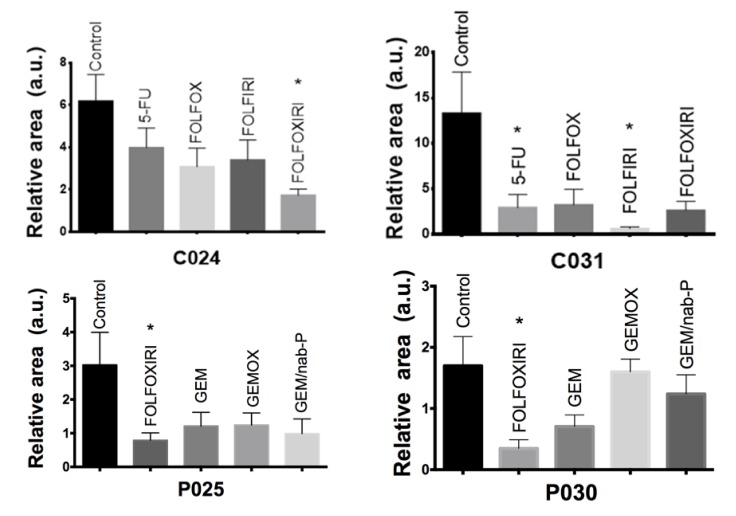
Figure 10.
Chemosensitivity assay. Two dpf embryos were injected with fragments of patient tumor tissue and incubated for 48 h with chemotherapy compounds at the ED. Representative cases of colon cancer (C024 and C031 patient-derived xenograft (PDX)) and pancreatic cancer (P025 and P030 PDX) with quantitative analysis of the relative tumor area (2 dpi/2 hpi for colon and 2 dpi/1 dpi for pancreas). All graphs show an increase in the stained area over time in the control group. C024, P025, P030 show a statistically significant regression of the stained area size in the FOLFOXIRI treated group compared with control non-treated xenografts. C031 shows significant stained area reduction in 5-FU and FOLFIRI treated groups compared with control non-treated xenografts. Results are expressed as mean ± SEM and analyzed by 1-way ANOVA followed by Dunnett’s multiple comparisons test. * p < 0.05. C024: n = 5, 7, 8, 9, 5 and C031: n = 8, 7, 5, 5, 4, respectively for control, 5-FU, FOLFOX, FOLFIRI, FOLFOXIRI. P025: n = 9, 9, 8, 9, 7 and P030: n = 5, 5, 9, 3 respectively for control, FOLFOXIRI, GEM, GEMOX, GEM/nab-P.

