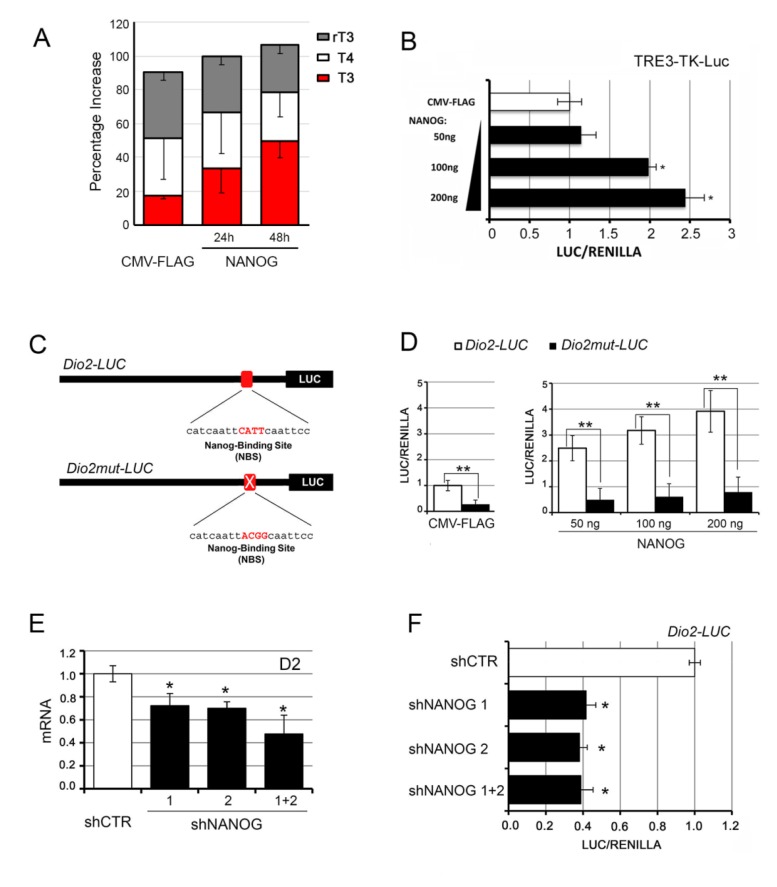
Figure 2.
NANOG downregulation reduces the expression of D2 in BCC cells. (A) Levels of T3, T4, and rT3 measured by HPLC–MS in the culture medium of BCC cells transiently transfected with NANOG. Values are expressed as percentage of total thyroid hormones (THs). (B) BCC cells were transiently transfected with the TRE3-TK-LUC promoter and with increasing amounts of the NANOG plasmid. Cells were harvested 48 h after transfection and analyzed for luciferase activity. CMV-Renilla was co-transfected as an internal control. The results are shown as means ± SD of the LUC/Renilla ratio from at least three separate experiments, performed in triplicate; * p < 0.05, ** p < 0.01. (C) Schematic representation of the NANOG binding site mutation within the Dio2 promoter region. (D) BCC cells were transiently transfected with Dio2-LUC promoter or Dio2mut-LUC promoter and CMV-FLAG (left) or increasing amounts of NANOG plasmid (right). Cells were harvested 48 h after transfection and analyzed for luciferase activity. CMV-Renilla was co-transfected as an internal control. The results are shown as means ± SD of the LUC/Renilla ratio from at least three separate experiments, performed in triplicate; * p < 0.05, ** p < 0.01. (E) D2 mRNA expression was measured by real-time PCR in BCC cells transfected with two different NANOG shRNAs, as single plasmids or in combination, or a control (CTR) shRNA as indicated. (F) BCC cells were transiently transfected with Dio2-LUC promoter and with NANOG shRNA as in E. Cells were harvested 48 h after transfection and analyzed for luciferase activity. CMV-Renilla was co-transfected as an internal control. The results are shown as means ± SD of the LUC/Renilla ratio from at least three separate experiments, performed in triplicate; * p < 0.05, ** p < 0.01.

