Figure 3.
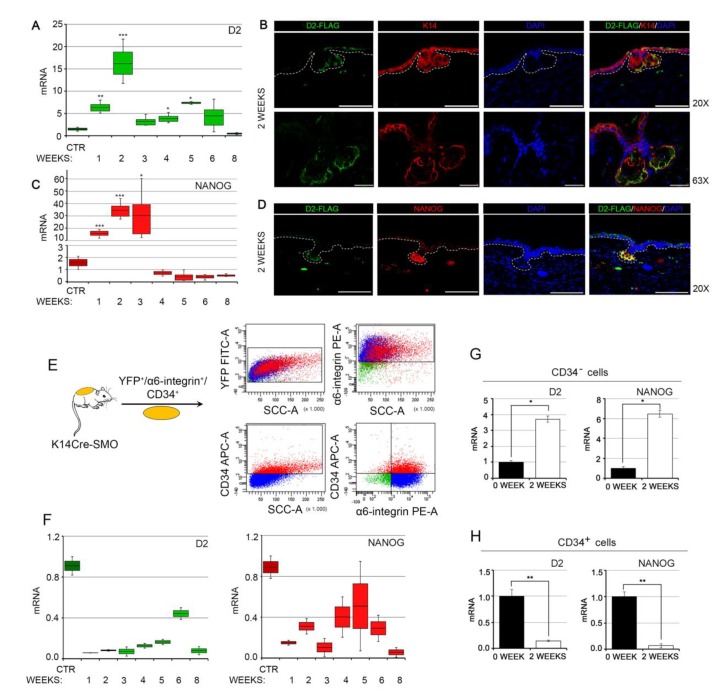
D2 expression correlates with NANOG expression during BCC tumor formation. (A) D2 expression was assessed by real-time PCR at different stages of BCC tumorigenesis in the adult epidermis of K14Cre-SMO mice. (B) D2 localization was assessed by immunofluorescence analysis two weeks after the induction of BCC tumorigenesis in the adult epidermis of K14Cre-SMO mice. Magnification 20× and 63×; scale bars represent 100 μm and 25 μm, respectively. (C) Relative expression of NANOG mRNA at different stages of BCC tumorigenesis, as in A. (D) Representative D2/NANOG co-staining was performed on paraffin-embedded skin sections at two weeks of BCC tumorigenesis from the ear epidermis of K14Cre-SMO mice. Magnification 20×; scale bars represent 100 μm. Data represent the mean of four independent experiments performed in triplicate. (E) Schematic representation of the strategy used to isolate cancer stem cell (CSCs) from K14Cre-SMO. (F) Transcriptional profile of D2 and NANOG in the CSCs population (CD34+ cells) during BCC tumorigenesis. (G) D2 and NANOG mRNA expression levels in FACS-isolated CSCs (CD34+ cells) were measured by real-time PCR. (H) D2 and NANOG mRNA expression levels in the FACS-isolated non-CSC population (CD34− cells) were measured by real-time PCR. Data represent the mean of four independent experiments performed in triplicate; * p < 0.05, ** p < 0.01, *** p < 0.001.

