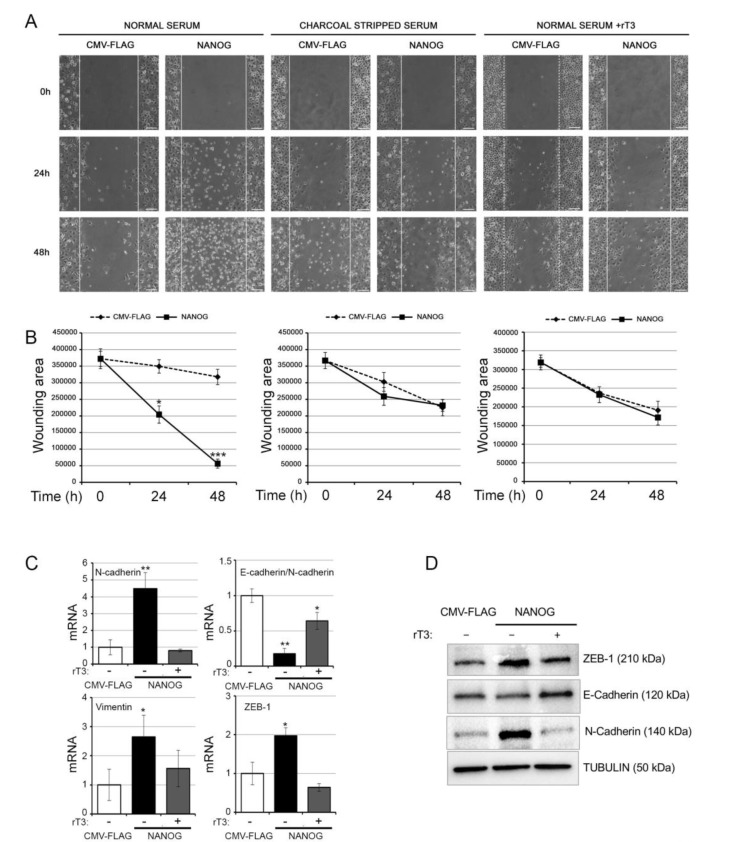
Figure 5.
D2 inhibition attenuates the migration and mesenchymal gene expression of BCC cells induced by NANOG. (A) A Wound scratch assay was performed with BCC cells transfected with THE NANOG plasmid or the CMV-FLAG plasmid. The migration index was measured at 0, 24, and 48 h, under three culture conditions: (i) normal serum, (ii) charcoal-stripped serum, and (iii) normal serum + 30.0 nM rT3. Scale bars represent 100 μm. (B) Summary graph showing wounding area at the indicated time points during the scratch wound assay as in A. Data represent the mean of three independent experiments performed in duplicate. (C) N-cadherin, E-cadherin/N-cadherin ratio, vimentin, and ZEB-1 mRNA levels in BCC cells transfected with the NANOG plasmid or the CMV-FLAG plasmid and treated or not with 30.0 nM rT3. (D) Western Blot analysis of E-cadherin, N-cadherin, and ZEB-1 expression in the same cells as in C. Tubulin expression was measured as a loading control. Data represent the mean of three independent experiments. * p < 0.05; ** p < 0.01.

