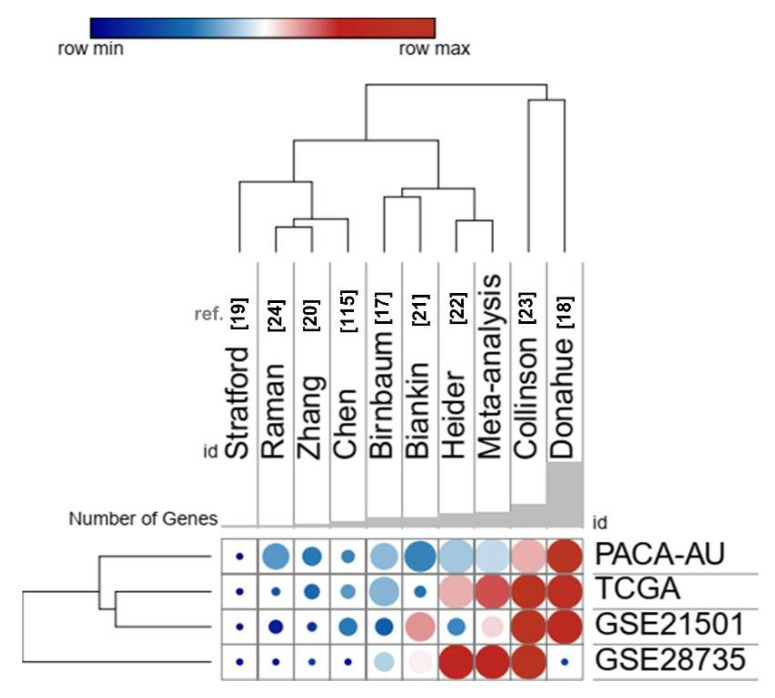
Figure 8.
Performance of expression profile from the 39 secretome genes as potential pancreatic ductal adenocarcinoma (PDAC) biomarkers compared to nine previously gene signatures proposed for PDAC [17,18,19,20,21,22,23,24,110]. The color of the circles in the heat scatter plot represents the agreement index, while the size of the circle is based on the log-rank p-value of the risk group separation based on the SurvExpress tool. Rows and columns were grouped based on the Euclidean distance between the agreement index values. Datasets of PDAC patients: PDAC-TCGA [108], PACA-AU—ICGC [109], GSE21501 [19], and GSE28735 [20,79].

