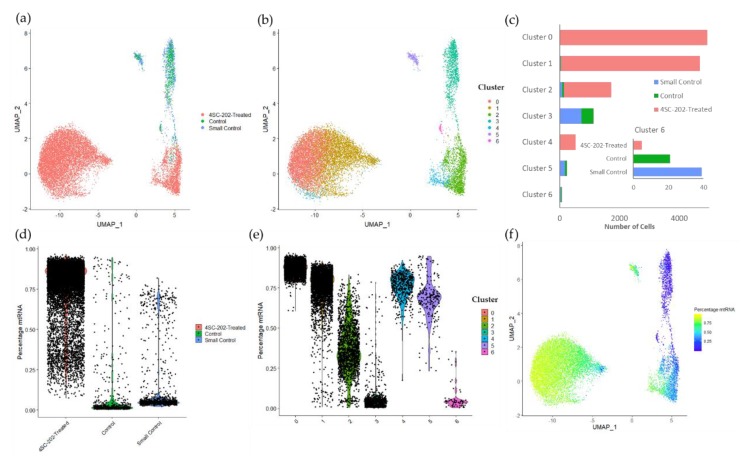
Figure 3.
Single cell RNA-sequencing (scRNA-seq) data clustering corresponds to differences in mtDNA expression levels and treatment group. (a) Depiction of Uniform Manifold Approximation and Projection (UMAP) dimensional reduction of integrated early untreated spheroid, vehicle-treated spheroid, and 4SC-202-treated spheroid scRNA-seq transcriptomic data. (b) UMAP plot of graph-based clustering of integrated scRNA-seq datasets. Clustering algorithm optimizes to 7 clusters. (c) Number of cells per cluster by sample group. Inset: Cluster 6 by sample group. (d) Violin plot of the percentage of raw reads that are mapped to mtRNA across experimental conditions. (e) Violin plot of the percentage of raw reads mapped to mtRNA across clusters. (f) UMAP plot of integrated spheroids colored by the percentage mtRNA.

