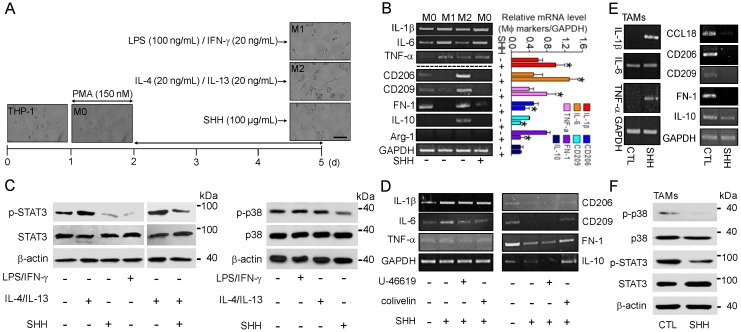
Figure 3.
SHH-induced upregulation of M1 markers and downregulation of M2 markers in both human macrophages and tumor-associated macrophages (TAMs). (A) PMA-treated THP-1 polarization into M1 and M2 macrophages by LPS/IFN-γ and IL-4/IL-13 treatment for 3 days, respectively. M0 macrophages were activated by SHH. Ten independent experiments were performed (n = 10). Scale bar, 50 μm. (B) SHH-induced upregulation of IL-1β, IL-6, and TNF-α and downregulation of CD206, CD209, and fibronectin-1 (FN-1) in the macrophages. SHH was added to M0 cells for 3 days. The bar graph shows the relative mRNA levels of the macrophage markers compared to that of GAPDH. Each bar is the mean ± SD obtained from four independent experiments (n = 4). * p < 0.05 compared to each corresponding control. (C) SHH-induced downregulation of STAT3 and p38 activities in THP-1-differentiated M0 cells. LPS/IFN-γ, IL-4/IL-13, and/or SHH was added to M0 cells for 8 h. Total protein (35 μg of protein per lane) was analyzed by immunoblotting assay. (D) Reduction of SHH’s effect on the mRNA expression of the M1 and M2 markers by STAT3 activator. U-46619, colivelin, and SHH were added to M0 cells for 48 h. (E) SHH-induced upregulation of IL-1β, IL-6, and TNF-α and downregulation of CD206, CD209, fibronectin-1 (FN-1), and IL-10 in TAMs. SHH was added to TAMs for 48 h. (F) SHH-induced downregulation of STAT3 and p38 activities in TAMs. SHH was added to TAMs for 8 h. Total protein (35 μg of protein per lane) was analyzed by immunoblotting assay. GAPDH and β-actin were used as loading controls for comparing the mRNA and protein expression levels among treatments, respectively. Five independent experiments were performed (n = 5).

