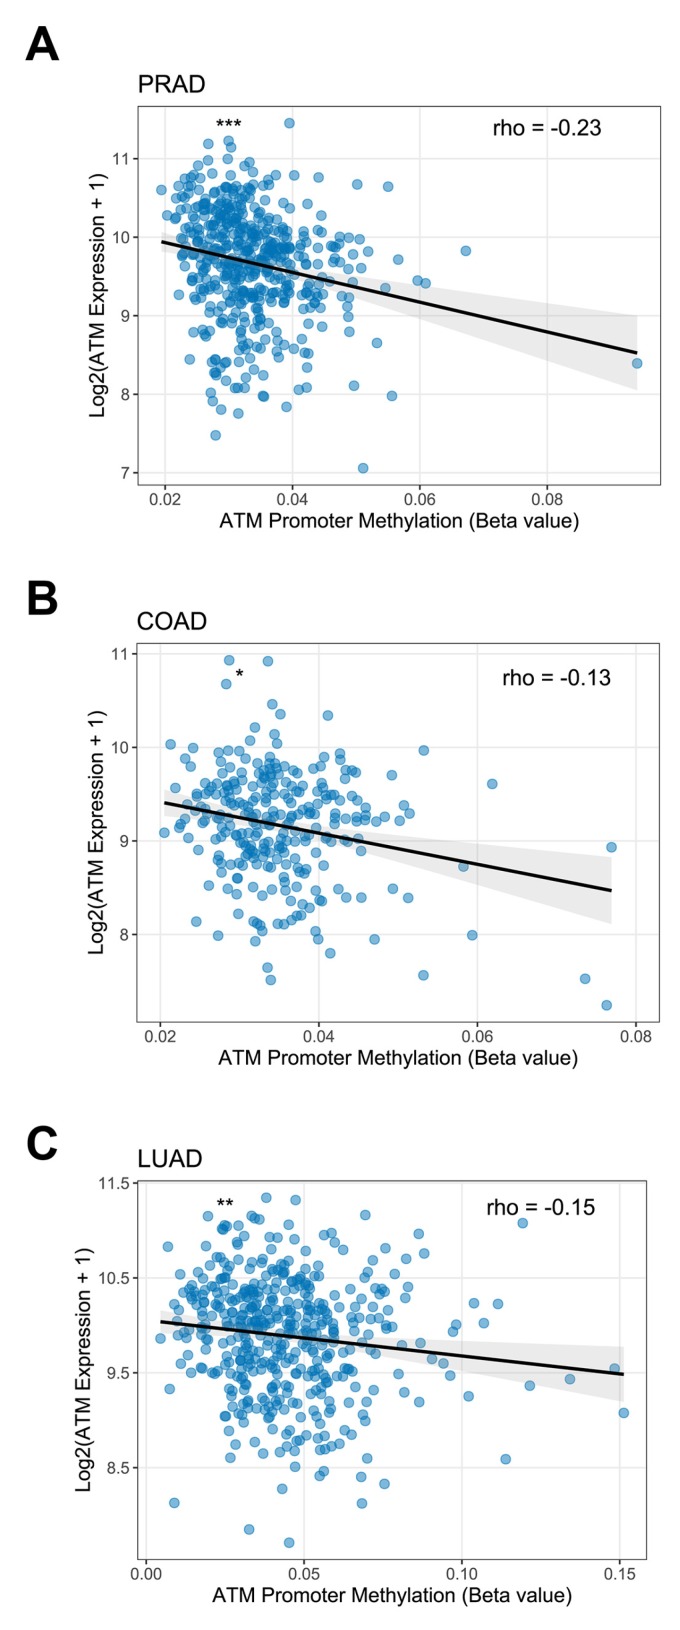
Figure 2.
ATM promoter methylation and ATM gene expression in adenocarcinomas. Scatter plots showing the correlation between methylation beta values of the ATM promoter probe cg01756564 and ATM gene expression in TCGA datasets of (A) prostate adenocarcinoma (PRAD, n = 496), (B) colon adenocarcinoma (COAD, n = 276) and (C) lung adenocarcinoma (LUAD, n = 454). Spearman’s rho values are indicated in the top right. Grey region of linear fit indicates 95% confidence interval. Asterisks in the top left indicate significance. * = p < 0.05, ** = p <0.01, *** = p < 0.001.

