Figure 2.
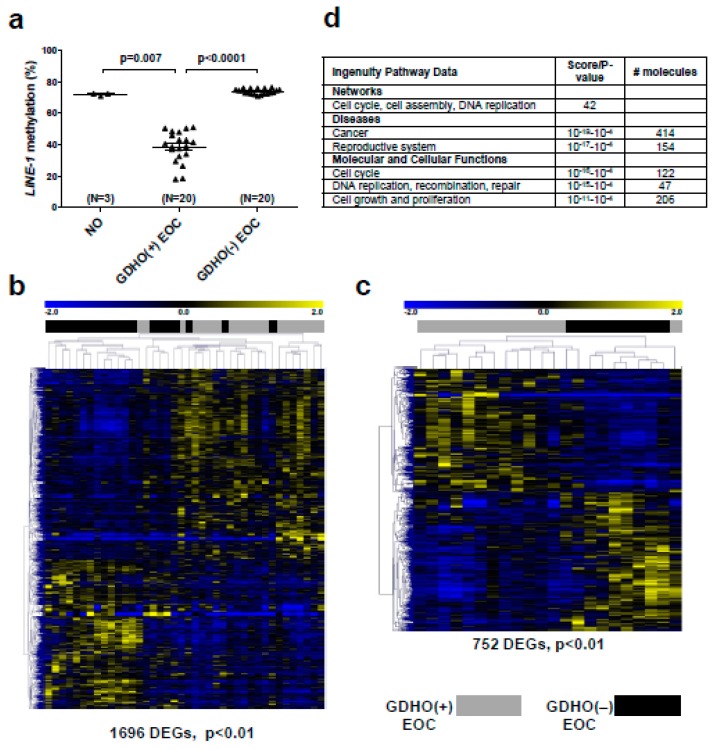
GDHO (+) EOC show distinct patterns of gene expression. (a) LINE-1 methylation in sample groups used for Affymetrix gene expression analyses: bulk normal ovary (NO), GDHO (+) EOC (i.e., LINE-1 hypomethylated group), GDHO (–) EOC (i.e., LINE-1 hypermethylated group). (b) Hierarchical clustering heat map of genes differentially expressed (p<0.01) between GDHO (+) vs. GDHO (–) EOC (all samples). (c) Hierarchical clustering heat map of genes differentially expressed between disease-matched (age-matched, stage 3/4, grade 3, serous EOC) GDHO (+) vs. GDHO (–) EOC. All tumors correspond to the HGSOC subtype. The number of genes showing significant differential expression in each comparison is indicated. Sample identities are indicated at top (see key). (d) Selected Ingenuity Pathway Analyses (IPA) data for the GDHO (+) vs. GDHO (–) EOC microarray comparison.

