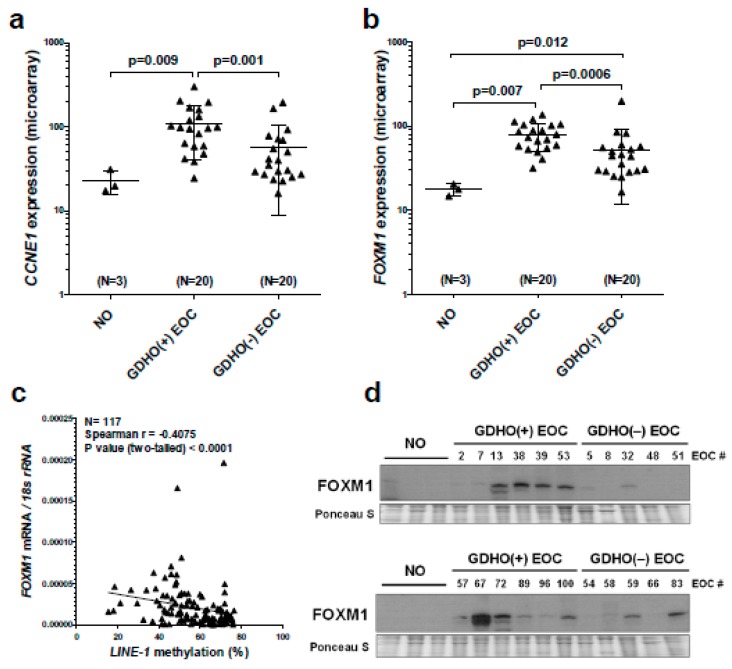
Figure 3.
CCNE1 and FOXM1 are overexpressed in GDHO (+) EOC. (a) CCNE1 expression in NO, GDHO (+) EOC, and GDHO (–) EOC, determined by Affymetrix microarray. (b) FOXM1 expression in NO, GDHO (+) EOC, and GDHO (–) EOC, determined by Affymetrix microarray. Means ± SD are plotted, and Mann–Whitney p-values are indicated. (c) FOXM1 mRNA expression vs. LINE-1 methylation in an expanded set of EOC tumor samples. FOXM1 expression was measured by RT-qPCR and LINE-1 methylation was measured by pyrosequencing. Spearman test results and p-value are shown. (d) Western blot analysis of FOXM1 protein expression in NO, GDHO (+) EOC, and GDHO (–) EOC. The upper and lower blots are comprised of different sets of samples. Ponceau S staining is shown as a loading control.

