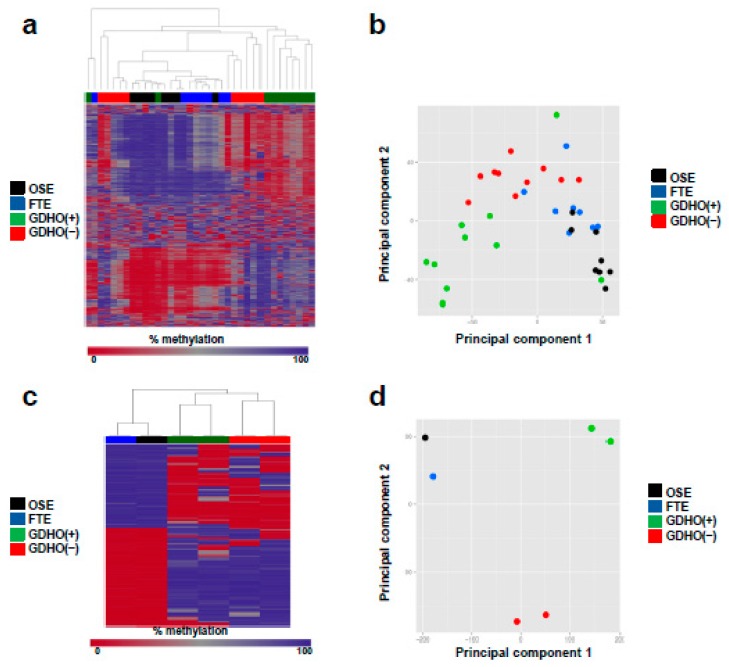
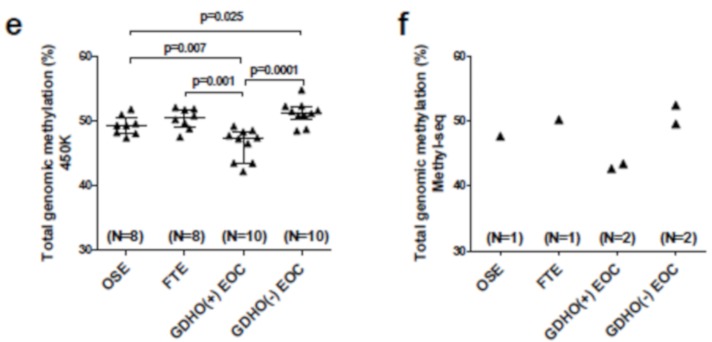
Figure 5.
DNA methylome analysis of GDHO (+) EOC. (a) Dendogram showing relatedness of OSE, FTE, GDHO (+) EOC, and GDHO (–) EOC DNA methylomes, using Illumina 450K data. Data for the 1000 most variable CpG sites is shown. (b) Principal component analysis (PCA) of sample groups, using 450K data. (c) Dendogram showing relatedness of OSE, FTE, GDHO (+) EOC, and GDHO (–) EOC methylomes, using Methyl-seq data. The 1000 most variable CpG sites is shown. (d) PCA of sample groups using Methyl-seq data. (e) Total genomic methylation of OSE, FTE and EOC sample groups as determined using 450K data. Median and interquartile ranges are plotted, and the unpaired two-tailed t-test p-values are shown. (f) Total genomic methylation of OSE, FTE and EOC sample groups as determined using Methyl-seq data.


