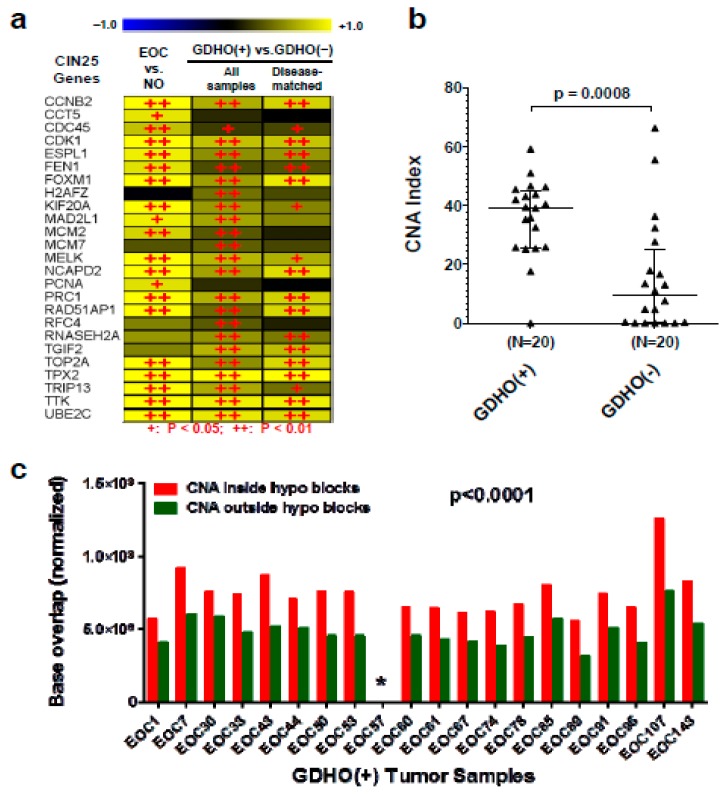
Figure 9.
GDHO (+) EOC tumors show increased CIN, and CNA are enriched within hypomethylated blocks. (a) Expression of CIN25 signature genes in the indicated sample comparisons. Gene expression was determined by Affymetrix microarrays, and log2 fold change values are shown. + p < 0.05, ++ p < 0.01. (b) CNA index in GDHO (+) EOC vs. GDHO (–) EOC. EOC samples are disease-matched and represent HGSOC. CNA were determined using Affymetrix Cytoscan HD chips as described in Methods. Median with interquartile range is plotted, and the Mann–Whitney p-value is shown. (c) CNA are enriched in hypomethylated blocks. The total base pair overlap between CNA and hypomethylated blocks, or outside hypomethylated blocks, in GDHO (+) EOC. Hypomethylated blocks were determined by Methyl-seq analysis of GDHO (+) EOC vs. normal epithelia (NE; OSE + FTE average), and CNA were determined as described in panel b. Hypomethylated block and non-hypomethylated block regions were normalized according to the percent genomic coverage of each. The two-way ANOVA p-value is shown. The asterisk indicates that the values are too low to be visible on the scale.

