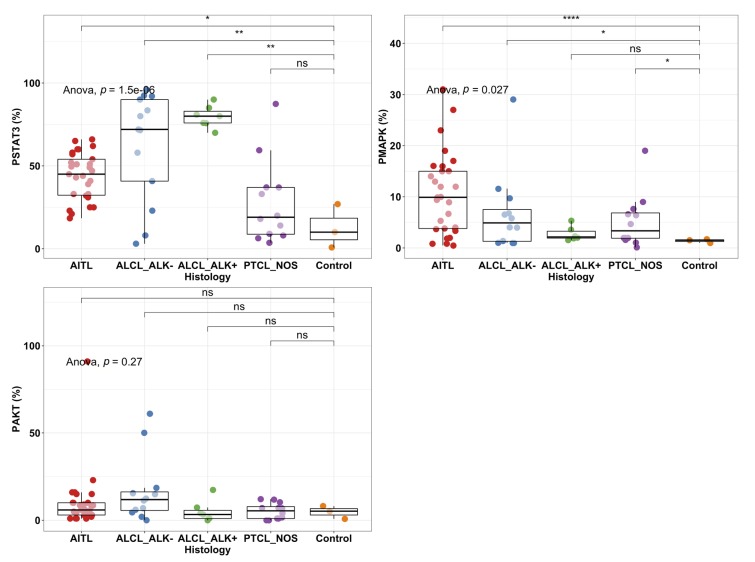
Figure 2.
Phosphorylation percentage of pY-STAT3, MAPK, and AKT in PTCL subgroups and healthy controls (n = 2–3) analyzed by immunohistochemistry. Individual dots represent the proportion of positive cells for pSTAT3, pMAPK, and pAKT. Boxplots represent the median and interquartile range of protein phosphorylation levels. The antibodies used were specific for Tyr705 (pStat3), Thr202/Tyr204 (pMAPK), and Thr450 (pAKT). Comparison was analyzed with ANOVA and post-hoc tests between disease groups and healthy controls. *: p < 0.05; **: p < 0.01, ****: p < 0.0001; ns: not significant.

