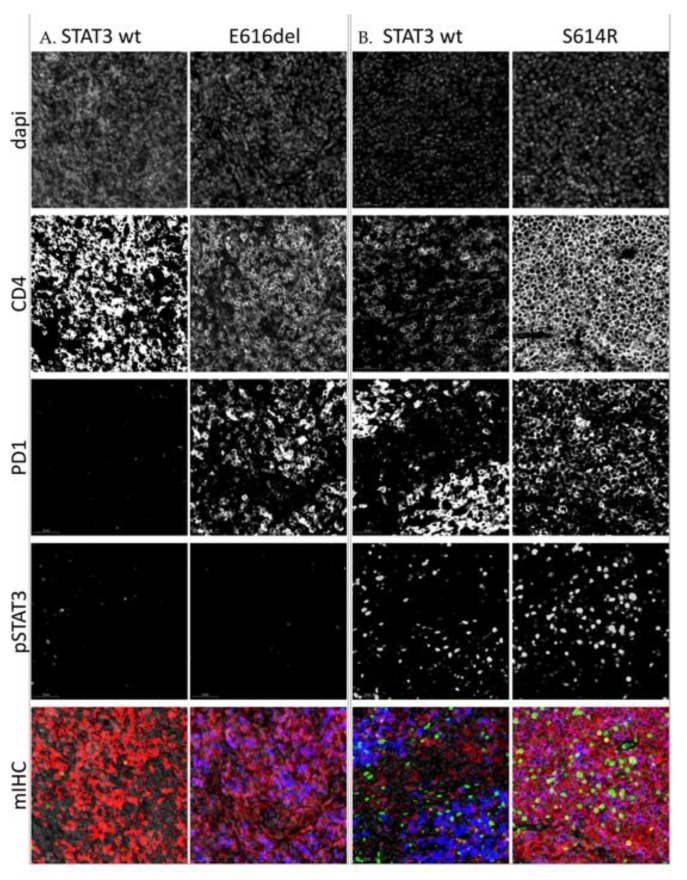
Figure 5.
IHC stainings of four angioimmunoblastic T-cell lymphoma (AITL) lymph node samples. (A). Samples containing low amount of pSTAT3. (B). Samples containing high amounts of pSTAT3. Each slide has been digitalized with a 20× lens and similar exposure time per channel. Images have been further magnified 30× for visualization purposes. The first four rows of images represent single stainings of dapi counterstain, CD4, PD1, and pSTAT3 (Tyr705), respectively, and the last figure their composite image. Staining: red = CD4, blue = PD1, green = pSTAT3.

