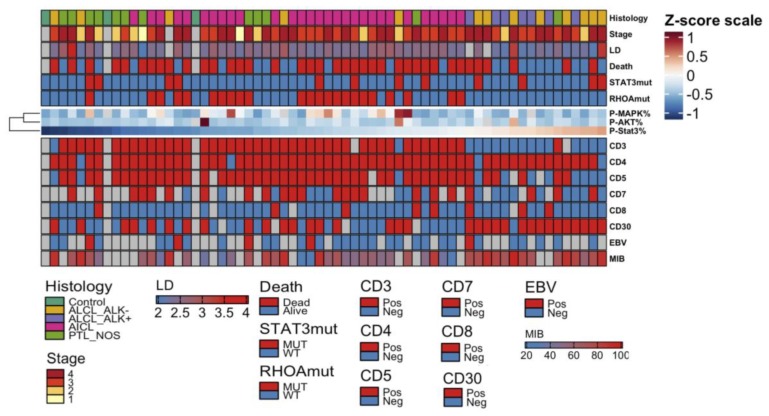
Figure 6.
Heatmap visualizing the quantity of pY-STAT3, pMAPK, and pAKT and their association with clinicopathological parameters. The amount of phosphorylated STAT3, MAPK, and AKT have been median-centered and max-scaled, and organized columnwise by pY-STAT3 quantity and rowwise by hierarchical clustering using Spearman correlation distance and Ward linkage (ward.D2) method. Red color denotes higher and blue color lower proportion. Clinical parameters denoting disease histology, disease stage, log10-transformed lactate dehydrogenase (LD) level, survival status, and STAT3 and RHOA mutation status are added as annotations over the heatmap. CD3, CD4, CD5, CD7, CD8, and CD30 immunophenotype status classified as positive or negative, EBV seropositivity and the MIB proliferation index (%) are presented below the heatmap.

