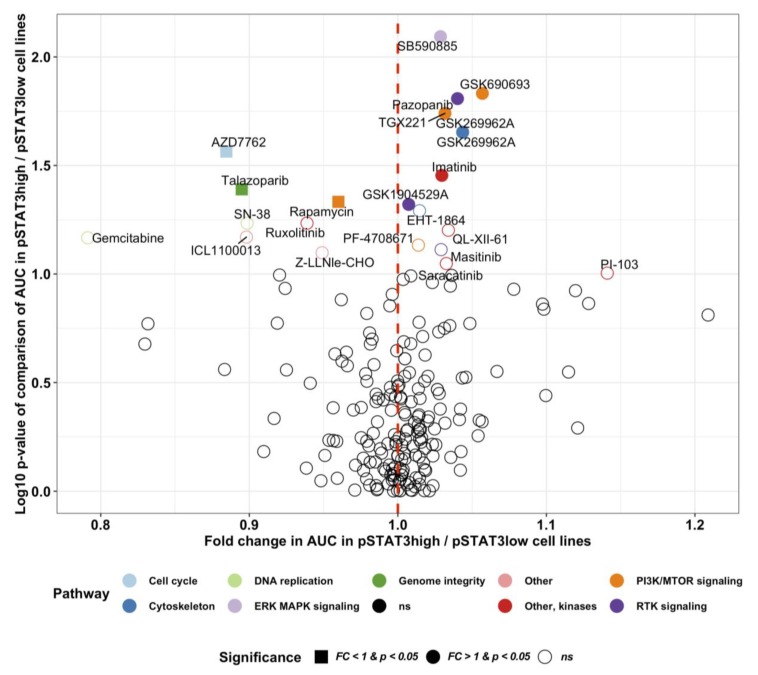
Figure 7.
Differential drug sensitivity in pSTAT3 high (n = 27) and low (n = 583) cancer cell lines. The pSTAT3 phosphorylation level has been quantified with reverse phase protein array (RPPA, cut-off pSTAT3Tyr705 = 1). The drug sensitivity data represent the area under the curve (AUC) response of 265 different phamacological compounds, and has been retrieved from the Sanger GDSC dataset. The RPPA data are derived from the Broad Institute the Cancer Cell Line Encyclopedia (CCLE) database. Differential drug sensitivity has been computed with multiple T-tests, and the fold change defined as the mean AUC ratio in pSTAT3 high-to-low cell lines. Drugs with a fold change (FC) less than 1.0 are more sensitive in pSTAT3 high cell lines. The target pathway of the top pharmacological hits have been color-labeled.

