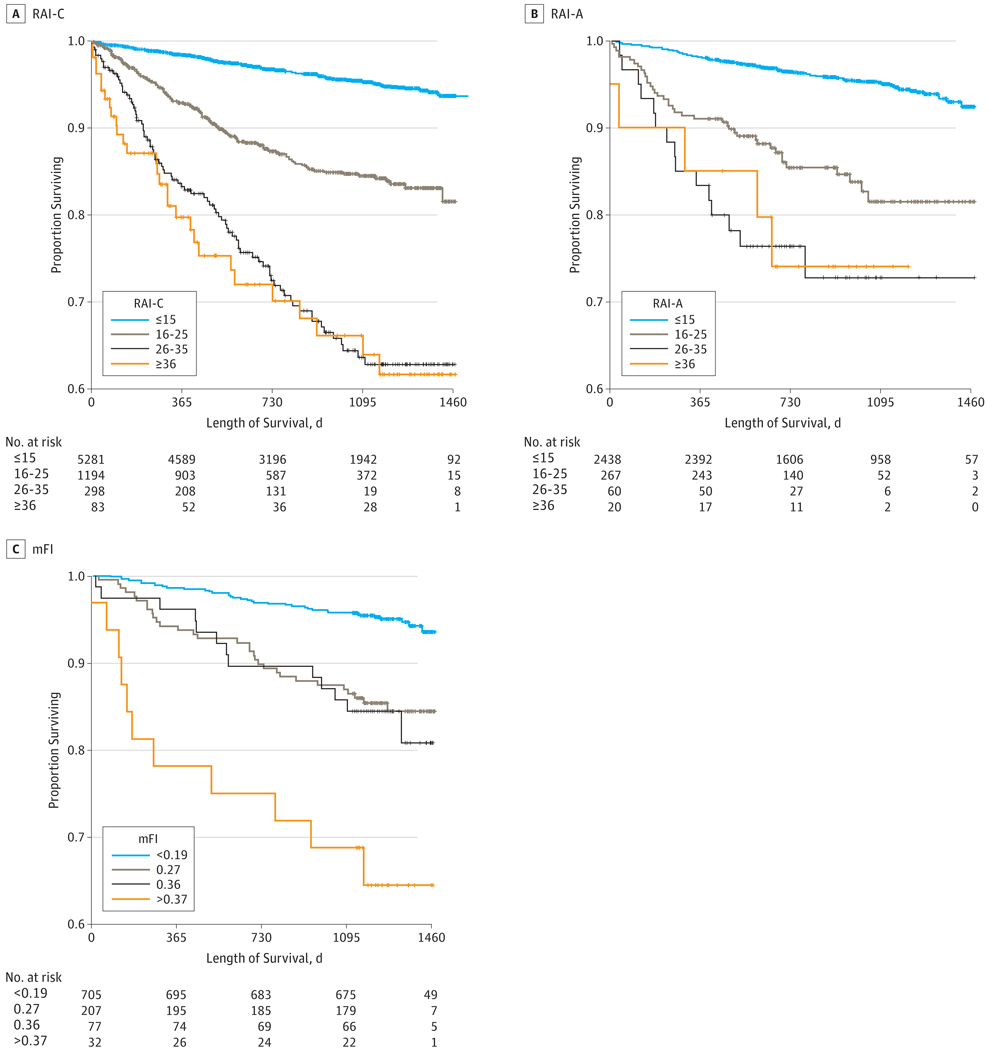
Figure 2. Survival Curves for Clinical Risk Analysis Index (RAI-C), Administrative Risk Analysis Index (RAI-A), and Modified Frailty Index (mFI).
A, n = 6856. Overall difference between 4 curves significant at P < .001 (log rank); pairwise comparisons significant at P < .001 for all comparisons except between 26 and 35 and 36 or higher. B, Overall difference between 4 curves significant at P < .001 (log rank); pairwise comparisons significant at P < .001 between 15 or less and the other 3 strata; and at P = .04 between 16 and 25 and 26 and 35. No significant difference between 26 and 35 and 36 or higher or between 16 and 25 and 36 or higher. C, Overall difference between 4 curves significant at P < .001 (log rank); pairwise comparisons significant at P < .001 between 15 or less and the other 3 strata; at P = .003 between 0.27 and 0.37 or higher; and at P = .03 between 0.26 and 0.37 or higher. No significant difference between 0.27 and 0.36.

