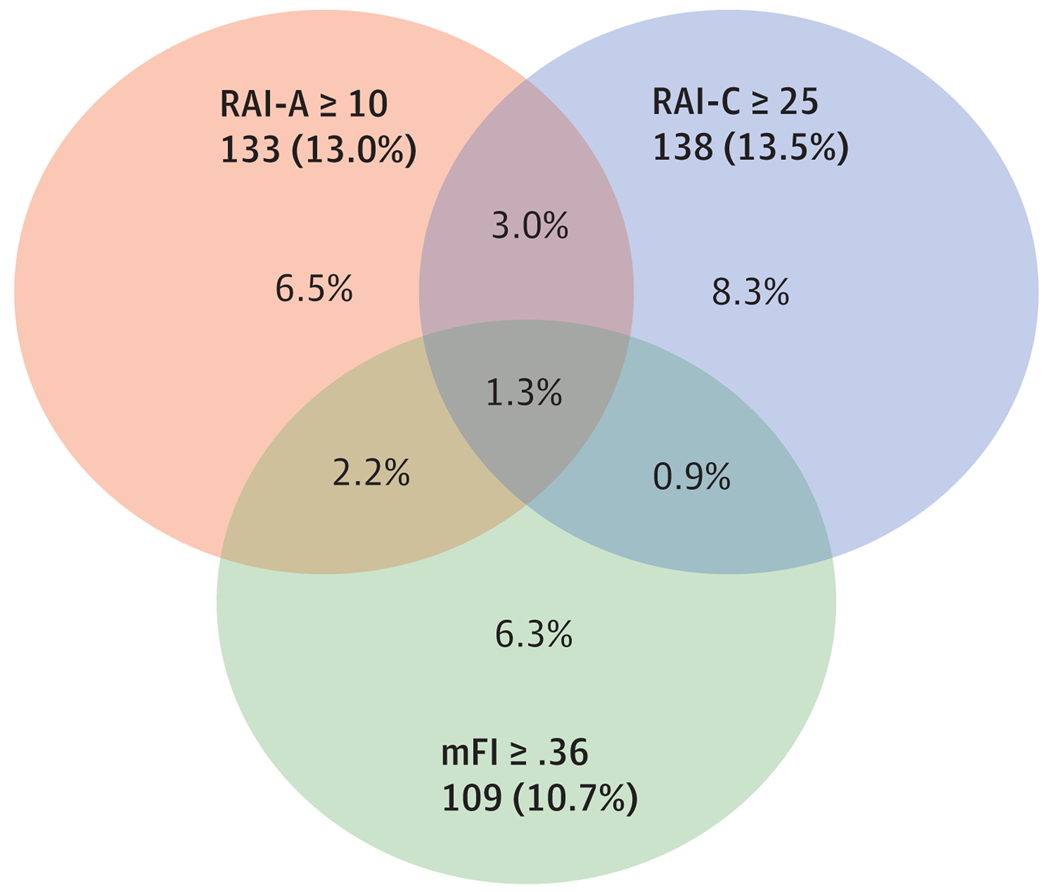
Figure 3. Relationship Between Clinical Risk Analysis Index (RAI-C), Administrative Risk Analysis Index (RAI-A), and Modified Frailty Index (mFI) (n = 1024).
Cutoffs of similar sensitivity were chosen and applied to the sample of 1024 patients with all 3 frailty measures. The total number and proportion of patients screening frail at the specified cutoffs are shown in the shaded box of each set. The Venn diagram depicts how the models differ in identifying respondents as frail. Proportions are based on the total sample.

