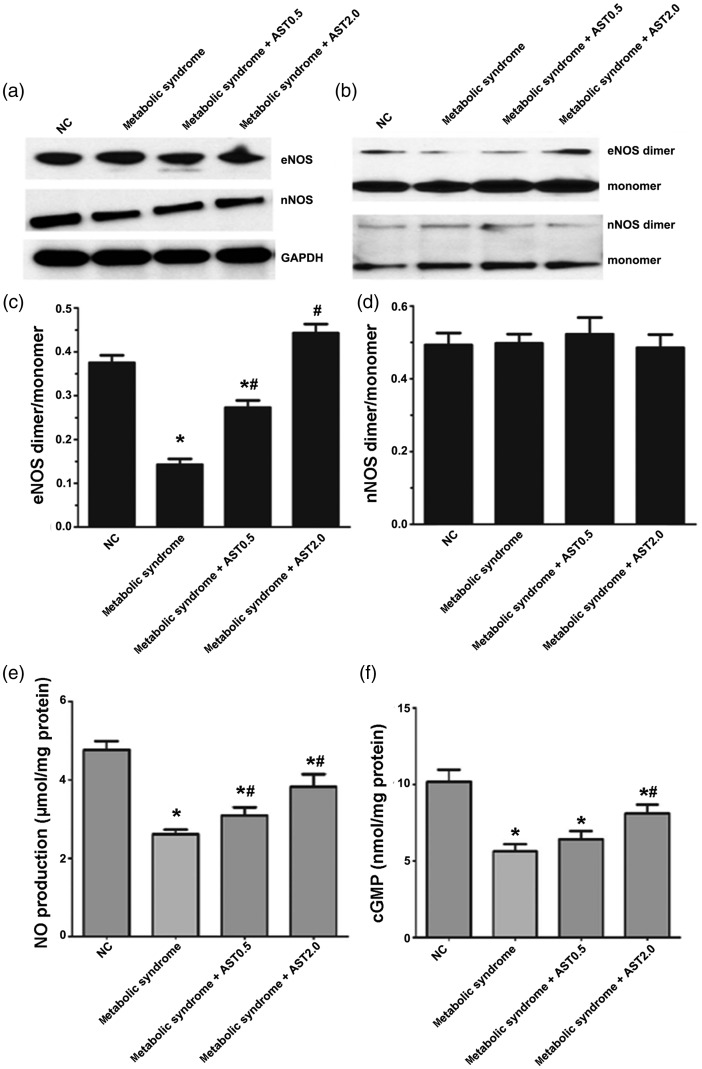
Figure 4.
Changes in NO signaling in normal and metabolic syndrome rats treated with or without AST. Representative images of western blots for (a) total eNOS and nNOS and (b) eNOS and nNOS dimers and monomers. (c) Ratios of eNOS and (d) nNOS dimers to monomers. (e) Total NO production normalized to protein content from the corresponding well. (f) cGMP levels in myocardium.
NO: nitric oxide, AST: astragaloside IV, eNOS: endothelial nitric oxide synthase, nNOS: neuronal nitric oxide synthase, NC: normal control. Data expressed as mean ± SEM (n = 6 for a–d; n=12 for e, f). *P < 0.05 vs. NC group; #P < 0.05 vs. metabolic syndrome group.

