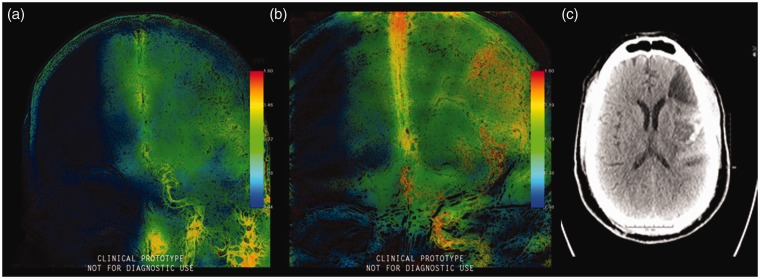
Figure 9.
(a) Pretherapeutic parametric blood flow wash-in rate color-coded images showing restricted diffusion in the middle cerebral artery territory, (b) post-therapeutic parametric blood flow wash-in rate color-coded images showing middle cerebral artery recanalization after treatment, and (c) noncontrast computed tomography showing evidence of hemorrhagic transformation.

