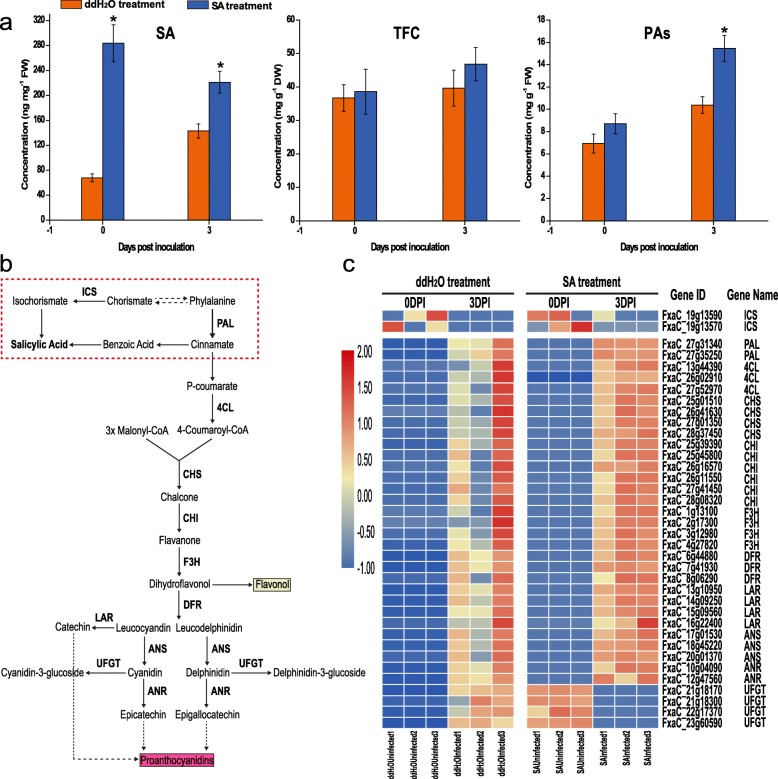
Fig. 3.
Salicylic acid (SA) content, total flavonoid content (TFC), and proanthocyanidins (PAs) in P. aphanis-infected strawberry leaves in the ddH2O-treated and SA-treated groups. a Concentration of SA, TFC, and PAs in strawberry leaves with or without SA treatment at two different infection time. Data are expressed as the mean ± standard deviation (SD) of three biological replicates. Different letters above the bar indicate statistically significant differences between groups at the same time point (P < 0.05). b Flavonoid pathway results in the formation of PAs. c Relative expression of PA biosynthesis genes. Heatmap was generated using the average values [log10 (FPKM+ 1)] of three biological samples per treatment

