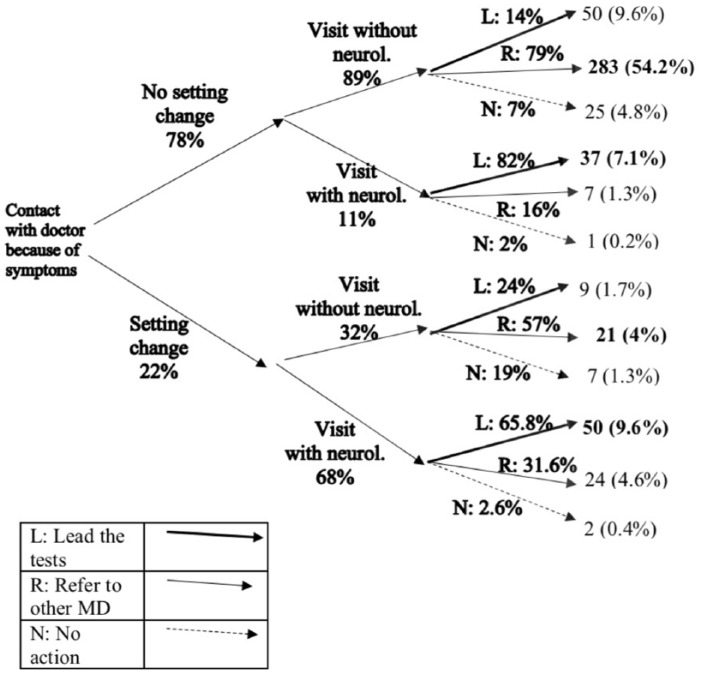
Figure 2.
Decision tree, from the first contact until the decisions on the clarification tests are taken.
L: lead the tests; R: refer to other medical doctor; N: no action.
Percentages displayed next to branches illustrate what population fraction within a node entered a specific branch and sum up to 100% for each bifurcation. Numbers indicated at each tree endpoint provide the frequency of participants who have had that combination of events, as well as their share (%) of the entire sample. Numbers in bold, on the right-hand side of the figure, are the most frequent action for each node.

