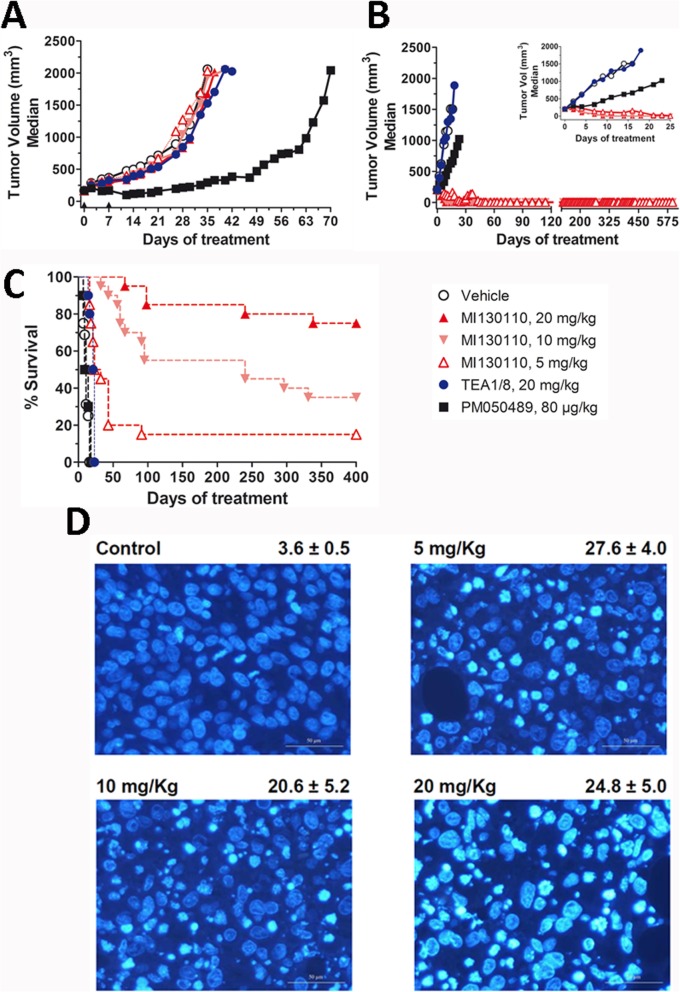
Fig. 5.
Biological effects of MI130110 in vivo. Animals (8–20 per group) were treated weekly for five consecutive weeks with either MI130110 at 5 (hollow triangles), 10 (pink inverted triangles), or 20 (red triangles) mg/kg, TEA1/8 at 20 mg/kg (blue circles), PM050489 at 80 μg/kg (black squares) or vehicle (hollow circles) following the procedure described in the “Materials and methods” section in mice xenografted with RPMI 8226 (a) or HT1080 (b and c) tumor cells. a and b show tumor growth evolution (with inset in b detailing HT1080 tumor evolution during the first 25 days), and c shows Kaplan-Meier survival curves for HT1080 xenografted animals. d Immunofluorescence analysis of tumor samples, withdrawn 24 h after the first treatment from mice xenografted with HT1080 tumor cells and treated with vehicle or with 5, 10, or 20 mg/kg MI130110, showing DNA staining with Hoechst 33258. Figures shown on the right hand side of each panel indicate the average (plus and minus the standard deviation) of the number of mitotic catastrophe nuclei per five high-power fields, with magnification being × 40

