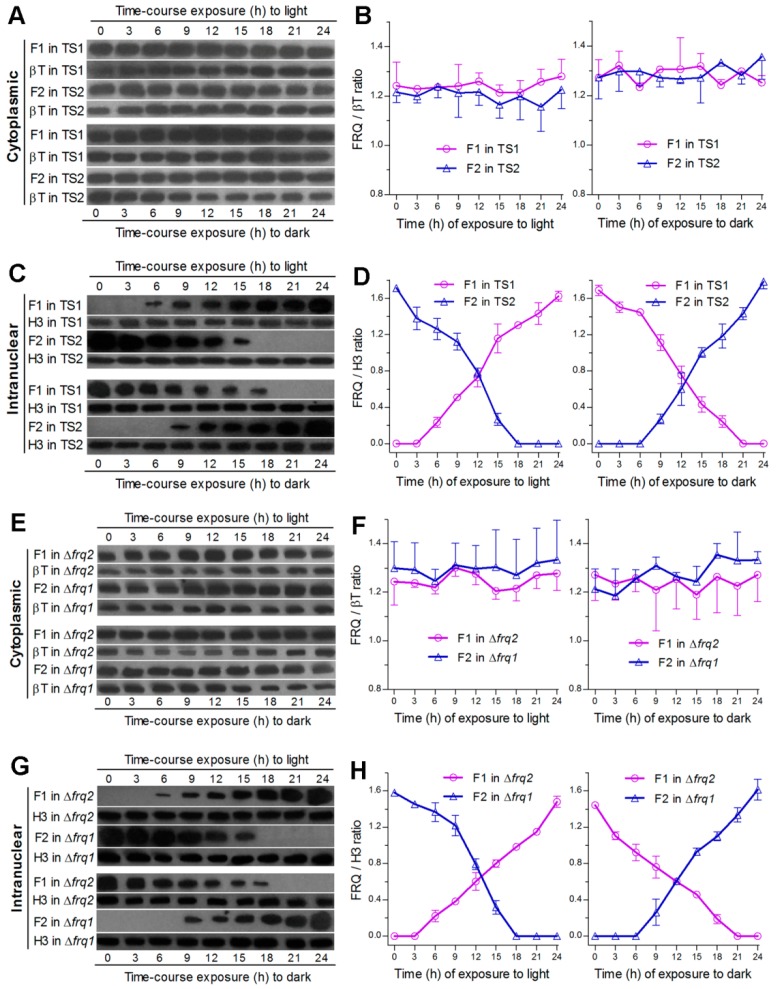
Figure 2.
Intracellular expression dynamics of Frq1 and Frq2 in time-course responses to light and dark cues. (A–D) Time-course western blots and relative expression levels of Frq1::GFP (F1) and Frq2::GFP (F2) in the cytoplasm and nucleus of the WT-based transgenic strains TS1 and TS2 respectively. (E–H) Time-course western blots and relative expression levels of F1 in the cytoplasm and nucleus of Δfrq2 and of F2 in the cytoplasm and nucleus of Δfrq1. All cytoplasmic and nuclear protein extracts were isolated from the hyphal cultures exposed 0–24 h (3-h interval) to light after continuous 60-h dark incubation (upper panels) or to dark after continuous 60-h light incubation (lower panels) of a 106 conidia mL−1 suspension in SDBY at 25 °C. Each fusion protein was probed by anti-GFP antibody. Nuclear standard: histone H3 probed by anti-H3 antibody. Cytoplasmic standard: β-tubulin (βT) probed by anti-β-tubulin antibody. Each lane was loaded with 60 μg protein extract. Each presented gel is a representative of three western replicates. Relative expression level of each fusion protein in cytoplasm or nucleus was estimated as the ratio of its blot intensity over that of β-tubulin or H3. Error bar: standard deviation (SD) of the mean from three replicates.

