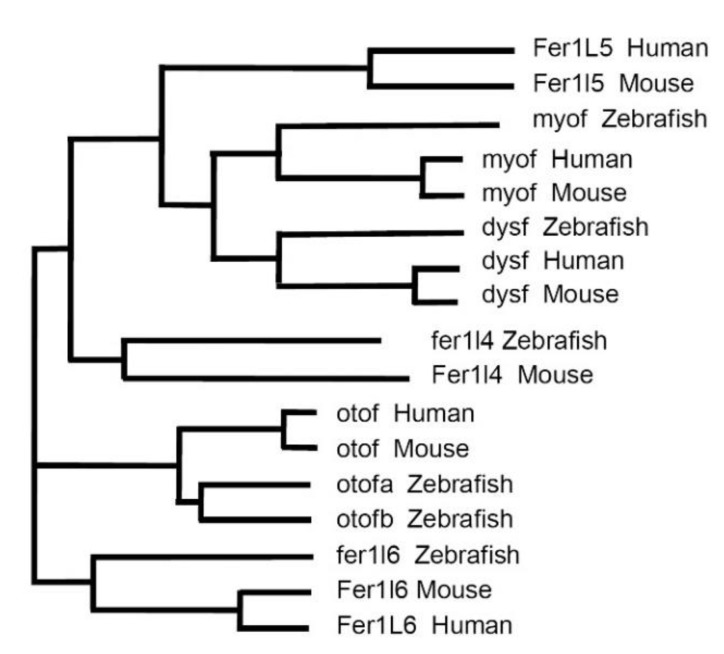
Figure 3.
Phylogeny of ferlins in humans, mouse and zebrafish. The phylogenetic tree was produced using Clustal Omega multiple sequence alignment program using default parameters [39] and translated protein sequences from Figure 2. The branch length is indicative of the evolutionary distance between the sequences.

