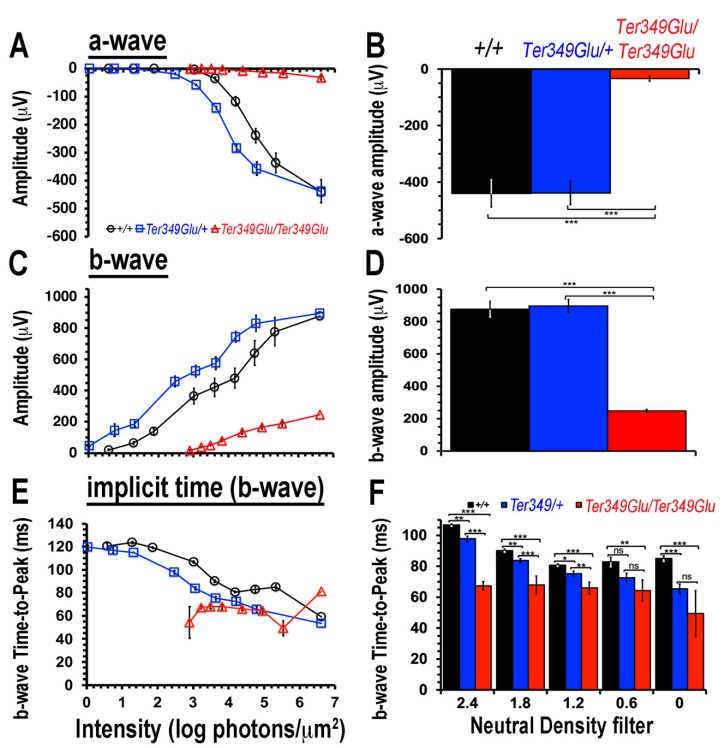
Figure 1.
Electroretinogram (ERG) responses decline in mice expressing Ter349Glu rhodopsin. Using ERG to record extracellular potential differences across the retina, the electrophysiological function of +/+, Ter349Glu/+, and Ter349Glu/Ter349Glu mice was monitored by measuring a-, b-waves, and response latencies (Time-to-Peak, TTP) under increasing stimulus intensities (A,C,E). Graphs compare maximum average wave amplitudes and TTP (B,D,F) under dark-adapted conditions. Data analyzed using two-tailed T-test and expressed as the mean ± S.E.M. *, p < 0.05; **, p < 0.01; ***, p < 0.001; ns, not significant.

