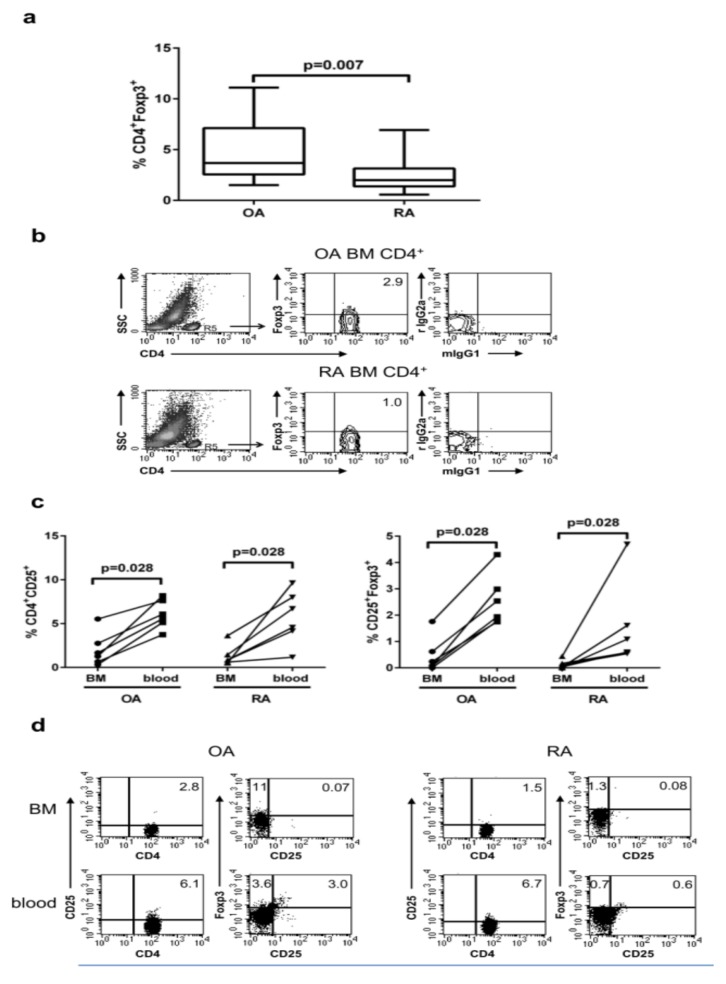
Figure 2.
Analysis of CD4+FOXP3+ T cells population in the BM. (a) Proportions of CD4+FOXP3+ cells in the BM of OA and RA patients. Data are presented as median with a min–max range (n = 16 subjects per group). Differences between groups of patients were analyzed by Mann–Whitney U-test. (b) Representative dot plots show FOXP3 expression by gated CD4+ T cells in OA and RA BM, respectively. (c) The percentage of CD4+CD25+ and CD25+FOXP3+ among CD4+ T cells from the peripheral blood and BM of the same patient is shown (n = 6). (d) Representative dot plot show CD25 and FOXP3 expression by gated CD4+ cells in the BM and peripheral blood of the same patient. Comparison of the BM with the blood from the same patient (done separately for OA and RA patients) was analyzed by the Wilcoxon test. Numbers depicted on dot plots show the frequencies of subset expressing the proper marker. OA/RA BM/blood — cells isolated from the BM/peripheral blood of patients with OA/RA, respectively.

