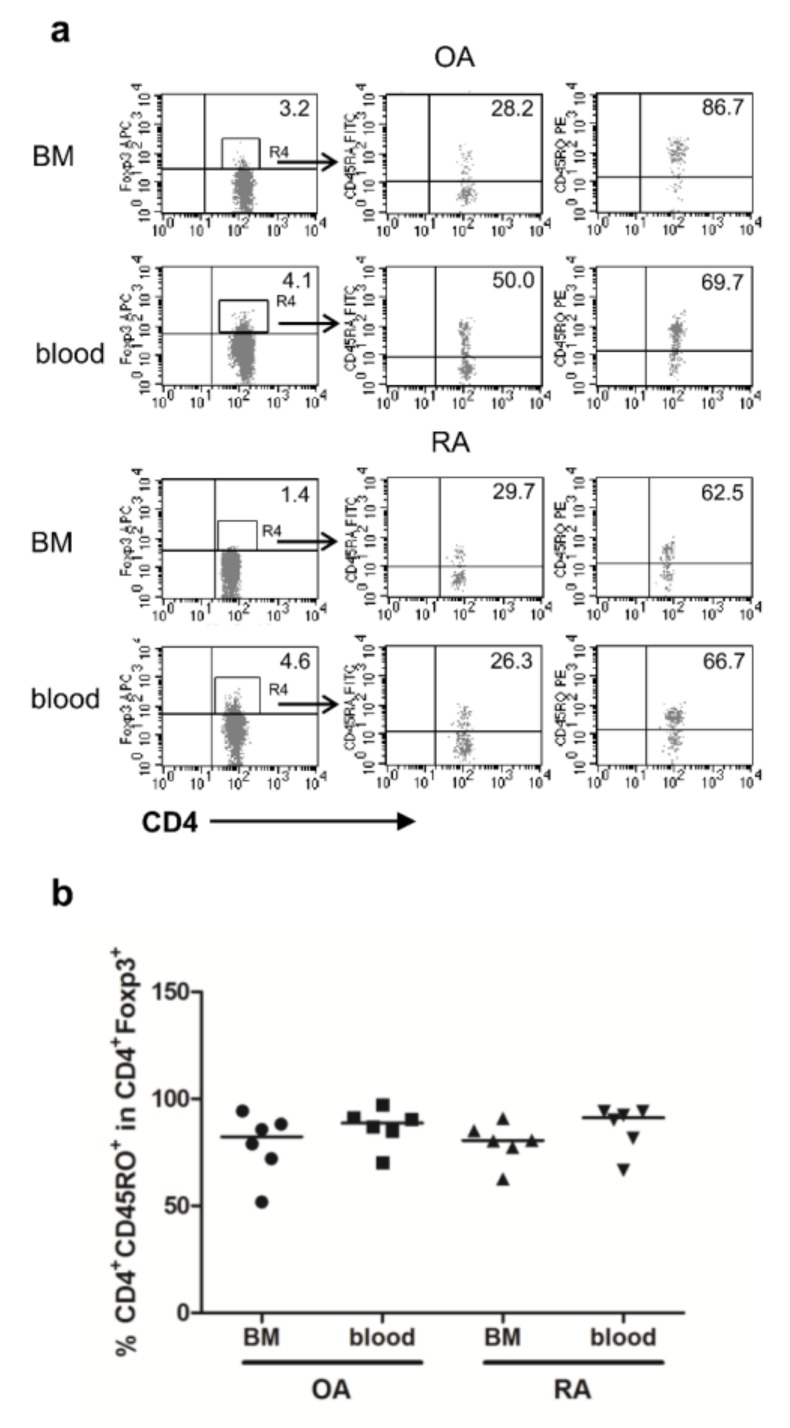
Figure 5.
CD45RO expression by gated CD4+FOXP3+ cells in the BM and peripheral blood of OA and RA patients. (a) Representative dot plots show CD45RA and CD45RO staining of CD4+FOXP3+ cells from the BM and peripheral blood from the same patient. (b) Expression of CD45RO by CD4+FOXP3+ Tregs from the BM and peripheral blood from OA and RA patients. Individual results are shown as dots and median as a bar on charts (n = 6 subjects per group). OA/RA BM/blood—cells isolated from the BM/peripheral blood of patients with OA/RA, respectively.

