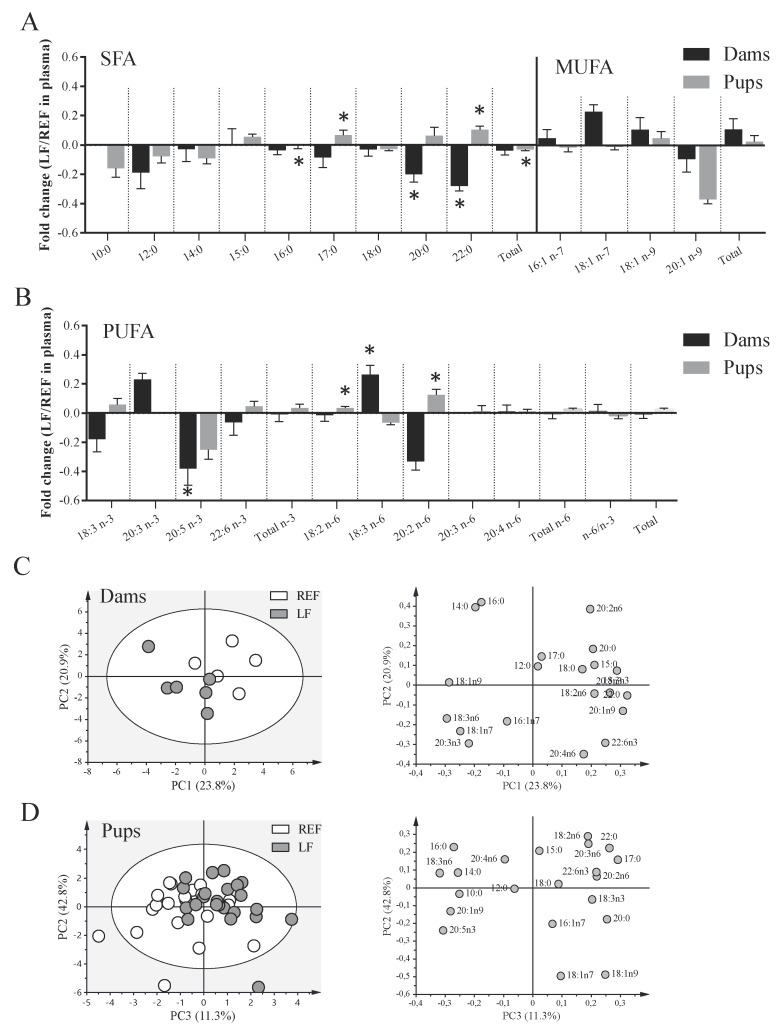
Figure 4.
Fatty acid profile in serum of dams and pups at L14. (A) Saturated (SFA) and monounsaturated (MUFA) fatty acids, (B) polyunsaturated (PUFA) fatty acids were quantified by GC-FID. The analysis of principal components was performed for both (C) dams’ and (D) pups’ samples and represented in score and loading plots. Fatty acid data was mean centered and scaled to unit variance. The % of explained variance is presented in parentheses. Results are expressed as mean ± S.E.M. (n = 6 dams/group and n = 24 pups/group). The fold change was calculated in respect to REF group. REF, reference group; LF, Lactobacillus fermentum CECT5716 group. * p < 0.05 compared to REF.

